
Aperçu
Cette stratégie est un système de trading quantitatif basé sur le croisement de moyennes mobiles et les indicateurs RSI, principalement utilisé pour le trading sur le marché des options. La stratégie utilise les signaux de croisement des moyennes mobiles rapides et lentes, combinés aux niveaux de surachat et de survente du RSI pour déterminer le moment des transactions, tout en définissant le take-profit et le stop-loss pour contrôler les risques. Cette stratégie est adaptée au trading sur une période de 5 minutes.
Principe de stratégie
La stratégie utilise deux indicateurs techniques clés : la moyenne mobile (MA) et l'indice de force relative (RSI). Spécifiquement:
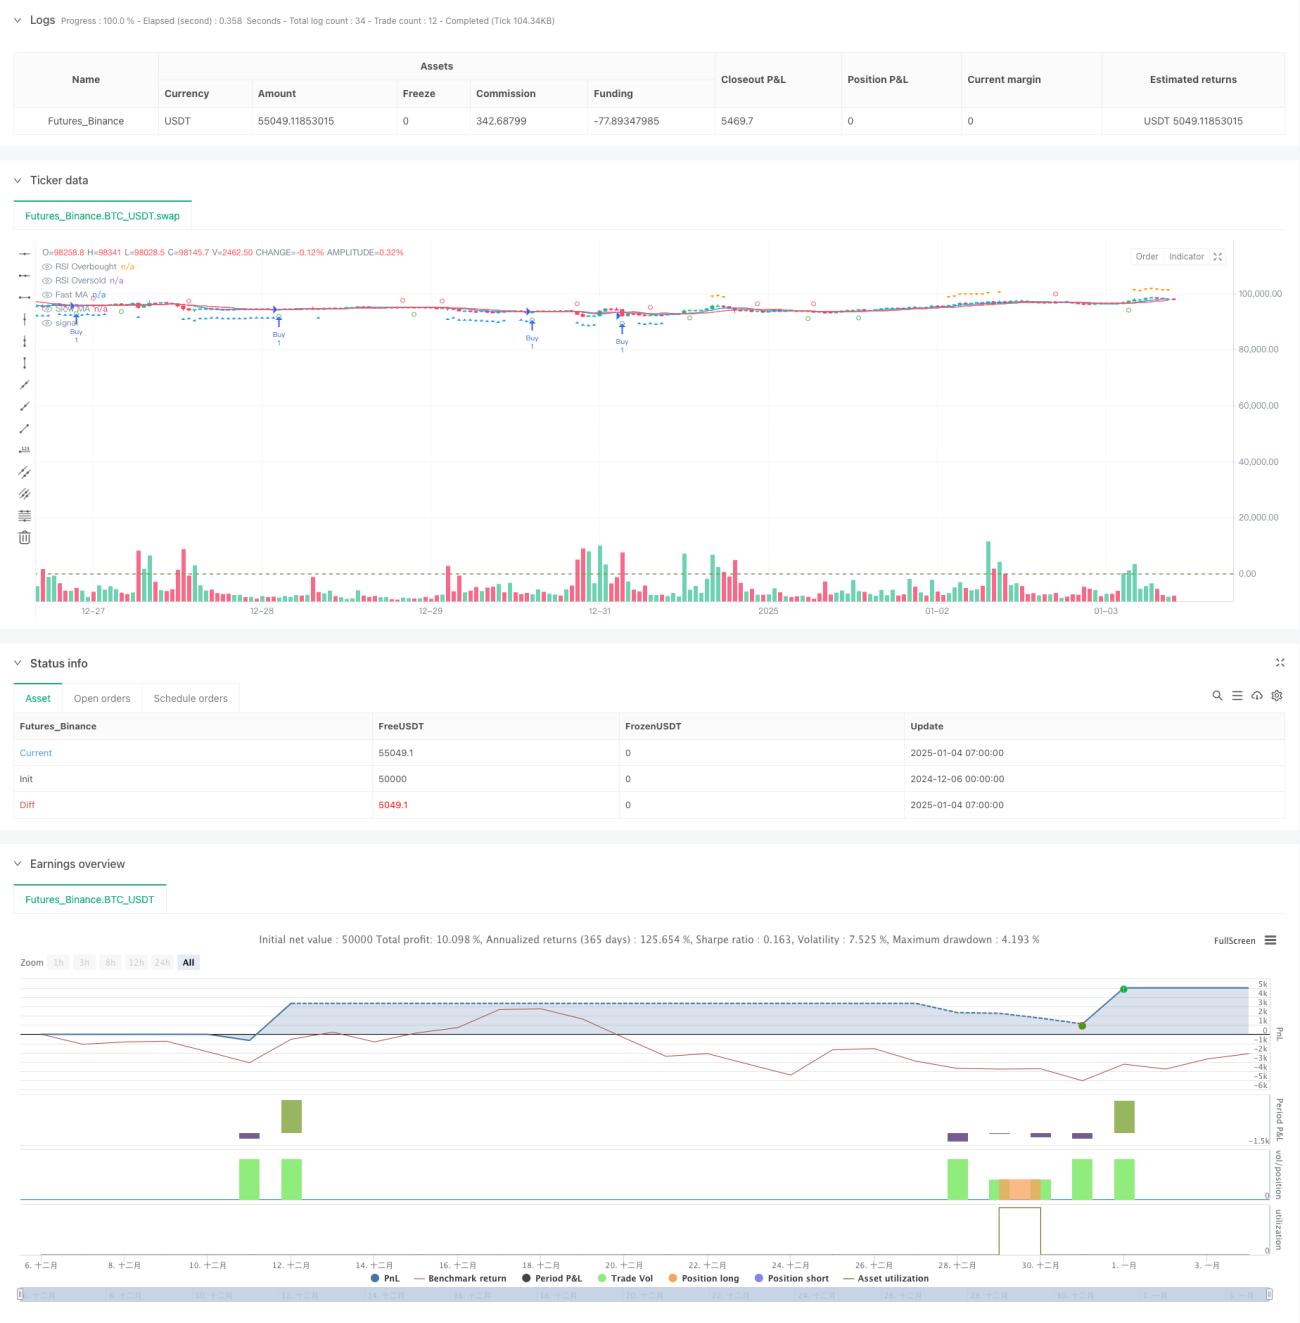
- Utilisez des moyennes mobiles simples (MMS) sur 7 et 13 périodes pour capturer les tendances des prix
- Utilisation de l'indicateur RSI à 17 périodes pour identifier les conditions de surachat et de survente
- Lorsque la moyenne mobile rapide croise la moyenne mobile lente vers le haut et que le RSI est inférieur à 43, le système génère un signal long
- Lorsque la moyenne mobile rapide croise la moyenne mobile lente vers le bas et que le RSI est supérieur à 64, le système génère un signal court
- Fixez un take profit de 4 % et un stop loss de 0,5 % pour gérer le risque
Avantages stratégiques
- Mécanisme de confirmation multiple : combinez le croisement de moyennes mobiles et les indicateurs RSI pour fournir des signaux de trading plus fiables
- Gestion parfaite des risques : définissez un pourcentage fixe de stop-profit et de stop-loss pour contrôler efficacement les risques
- Forte adaptabilité : les paramètres peuvent être ajustés de manière flexible en fonction des différentes conditions du marché
- Support de visualisation : la stratégie fournit des instructions graphiques claires pour aider les traders à comprendre les conditions du marché
- Règles de fonctionnement claires : conditions d'entrée et de sortie claires, réduisant les interférences causées par un jugement subjectif
Risque stratégique
- Risque de marché volatil : de fréquents faux signaux peuvent survenir dans un marché latéral et volatil
- Risque de glissement : lorsque le marché des options est illiquide, vous pouvez être confronté à un glissement important
- Sensibilité des paramètres : L’effet de la stratégie est sensible aux réglages des paramètres et doit être continuellement optimisé.
- Dépendance à l'environnement du marché : dans un environnement de marché volatil, le stop loss peut ne pas être suffisamment opportun
- Risque systémique : lorsque des gaps de marché ou des événements majeurs surviennent, le stop loss peut échouer
Orientation de l'optimisation de la stratégie
- Présentation des indicateurs de volatilité : envisagez d'intégrer les ATR ou les bandes de Bollinger dans votre système de prise de décision
- Optimiser l'adaptation des paramètres : Développer un mécanisme d'ajustement dynamique des paramètres en fonction des conditions du marché
- Augmentez le filtrage du sentiment du marché : combinez le volume des transactions et d'autres indicateurs pour filtrer les faux signaux
- Améliorer le mécanisme de stop loss : envisager d'introduire un stop loss suiveur pour améliorer l'efficacité de la gestion des risques
- Ajouter un filtre temporel : ajouter une limite de fenêtre de temps de trading pour éviter les transactions inefficaces
Résumer
Cette stratégie construit un système de trading relativement complet en combinant le croisement de moyenne mobile et les indicateurs RSI. Les avantages de la stratégie résident dans la confirmation multiple des signaux et une parfaite gestion du risque, mais il faut également prêter attention à l’impact de l’environnement de marché sur la performance de la stratégie. Grâce à une optimisation et une amélioration continues, cette stratégie devrait permettre d’obtenir des performances stables sur le marché des options. Il est recommandé aux traders d'effectuer des backtests et une optimisation des paramètres suffisants avant une utilisation en temps réel.
- 1