Stratégie de trading quantitative multi-séries temporelles basée sur le stop-profit et le stop-loss dynamiques lissés par l'EMA RSI et l'ATR

Aperçu
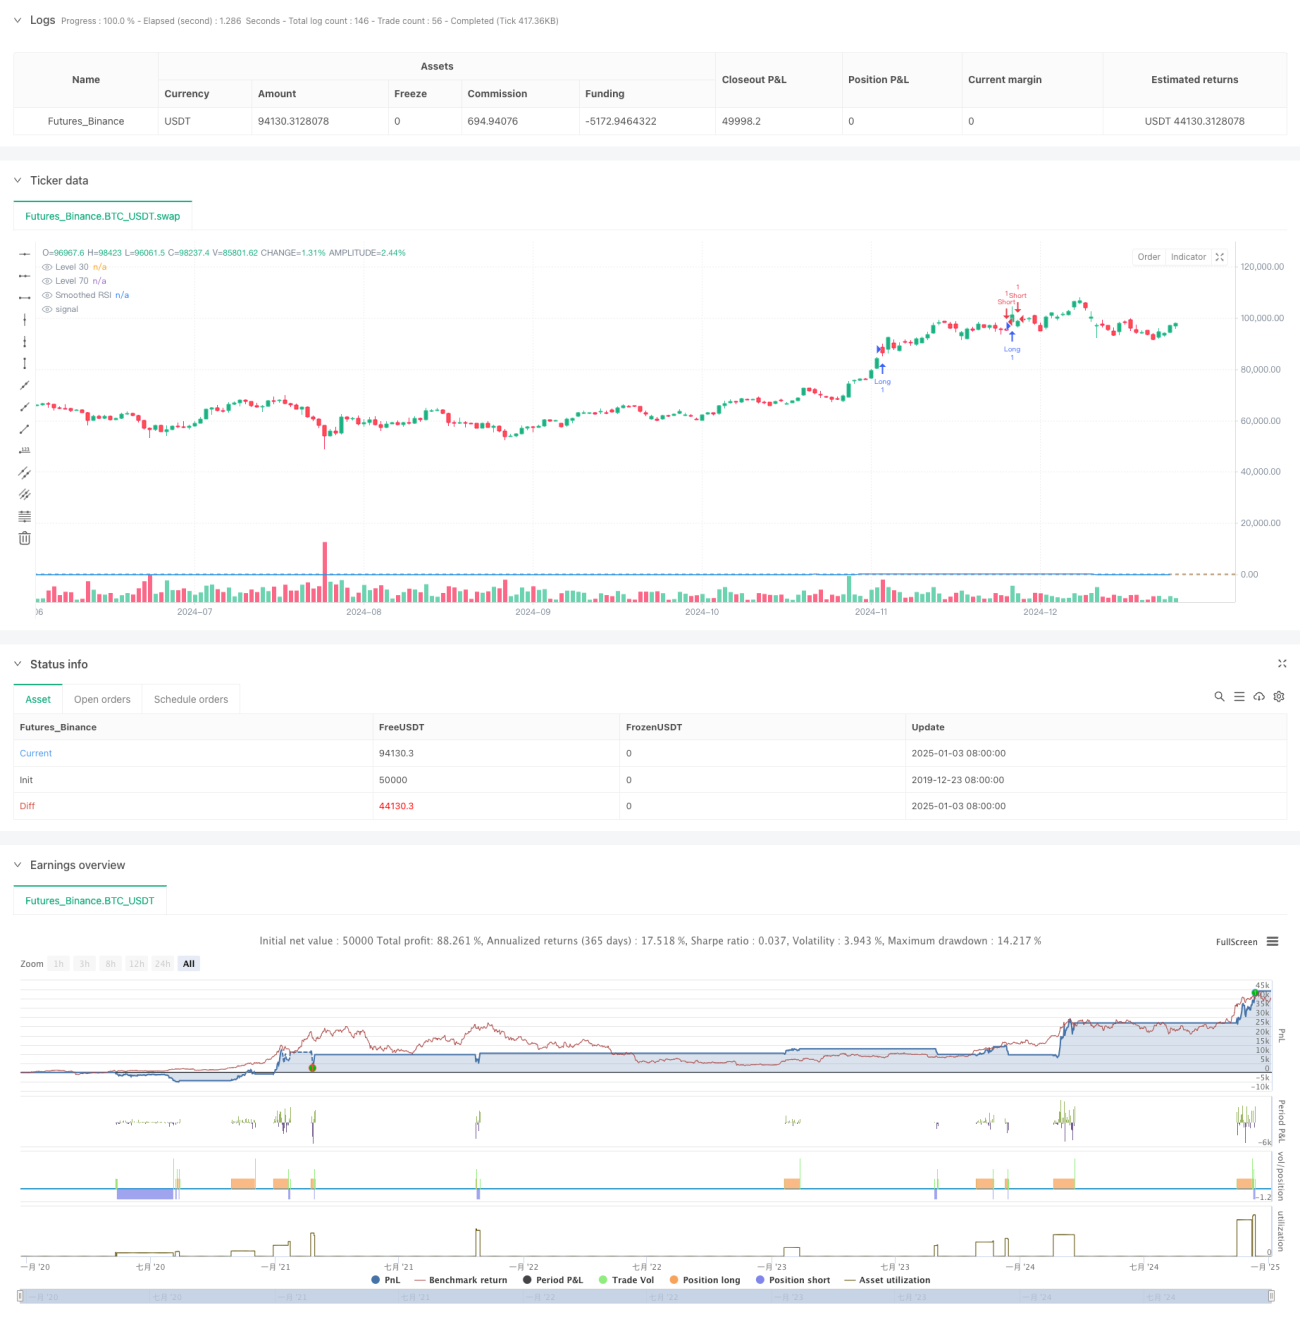
Cette stratégie est un système de trading quantitatif complet basé sur l'indice de force relative (RSI), la moyenne mobile exponentielle (EMA) et la plage réelle moyenne (ATR). La stratégie utilise l'EMA pour lisser le RSI, déclenche des transactions via des signaux de percée RSI à des niveaux clés et utilise l'ATR pour définir dynamiquement les niveaux de stop-loss et de take-profit afin d'obtenir un contrôle efficace des risques. Dans le même temps, la stratégie comprend également la fonction de comptage et d'enregistrement des signaux de trading, ce qui aide les traders à tester et à optimiser les stratégies.
Principe de stratégie
La logique fondamentale de la stratégie comprend les éléments clés suivants :
- Calculez les conditions de surachat et de survente du marché à l'aide du RSI sur 14 périodes
- Le lissage du RSI avec l'EMA réduit les faux signaux
- Générer des signaux de trading lorsque le RSI franchit les deux niveaux clés de 70 et 30
- Utilisez ATR pour calculer dynamiquement les positions stop loss et take profit afin d'améliorer la flexibilité de la gestion des risques
- Créez un tableau de comptage des signaux de trading pour enregistrer les informations de prix de chaque transaction
Avantages stratégiques
- Forte fluidité du signal : le RSI est lissé par l'EMA, ce qui réduit efficacement l'interférence des faux signaux de percée
- Contrôle parfait des risques : Adoptez la solution de stop loss dynamique ATR, qui peut ajuster la position du stop loss en fonction des fluctuations du marché
- Mécanisme de trading bidirectionnel : prend en charge les échanges bidirectionnels longs et courts pour saisir pleinement les opportunités du marché
- Paramétrage ajustable : les paramètres clés peuvent être personnalisés pour faciliter l'optimisation en fonction des différentes caractéristiques du marché
- Surveillance visuelle : enregistrez les signaux de trading dans des tableaux pour faciliter la surveillance de la stratégie et l'analyse des backtests
Risque stratégique
- Risque de fausse cassure du RSI : même après le lissage de l'EMA, le RSI peut toujours générer de faux signaux de cassure
- Stop loss ATR insuffisant : lorsque le marché fluctue violemment, un réglage incorrect du multiple ATR peut entraîner un stop loss trop lâche ou trop serré.
- Risque d'optimisation des paramètres : une suroptimisation des paramètres peut conduire à un surajustement de la stratégie
- Dépendance à l'environnement du marché : les performances peuvent différer considérablement sur les marchés en tendance et volatils
Orientation de l'optimisation de la stratégie
- Présentation de l'analyse sur plusieurs périodes : combinaison de signaux RSI à long terme pour la confirmation des transactions
- Optimisez le mécanisme de stop loss : envisagez d'ajuster dynamiquement le multiple ATR en combinaison avec les niveaux de support et de résistance
- Augmenter le jugement de l'environnement du marché : ajouter des indicateurs de jugement de tendance et ajuster les paramètres de stratégie dans différents environnements de marché
- Améliorer le filtrage des signaux : envisagez d'ajouter des indicateurs auxiliaires tels que le volume des transactions pour filtrer les faux signaux de percée
- Présentation de la gestion de position : ajustez dynamiquement la taille de la position en fonction de la force du signal et de la volatilité du marché
Résumer
Cette stratégie construit un système de trading quantitatif complet en combinant trois indicateurs techniques classiques : RSI, EMA et ATR. La stratégie est très pratique en termes de génération de signaux, de contrôle des risques et d’exécution des transactions. Grâce à une optimisation et une amélioration continues, la stratégie devrait permettre d’obtenir des performances stables dans le trading réel. Toutefois, les utilisateurs doivent prêter attention à l’impact de l’environnement du marché sur la performance de la stratégie, définir des paramètres raisonnables et faire un bon travail de contrôle des risques.
/*backtest
start: 2019-12-23 08:00:00
end: 2025-01-04 08:00:00
period: 1d
basePeriod: 1d
exchanges: [{"eid":"Futures_Binance","currency":"BTC_USDT"}]
*/

//@version=6
strategy("RSI Trading Strategy with EMA and ATR Stop Loss/Take Profit", overlay=true)
length = input.int(14, minval=1, title="RSI Length")
src = input(close, title="Source")- 1