Stratégie de trading d'inversion de dynamique à double indicateur technique combinée à un système de gestion des risques

Aperçu
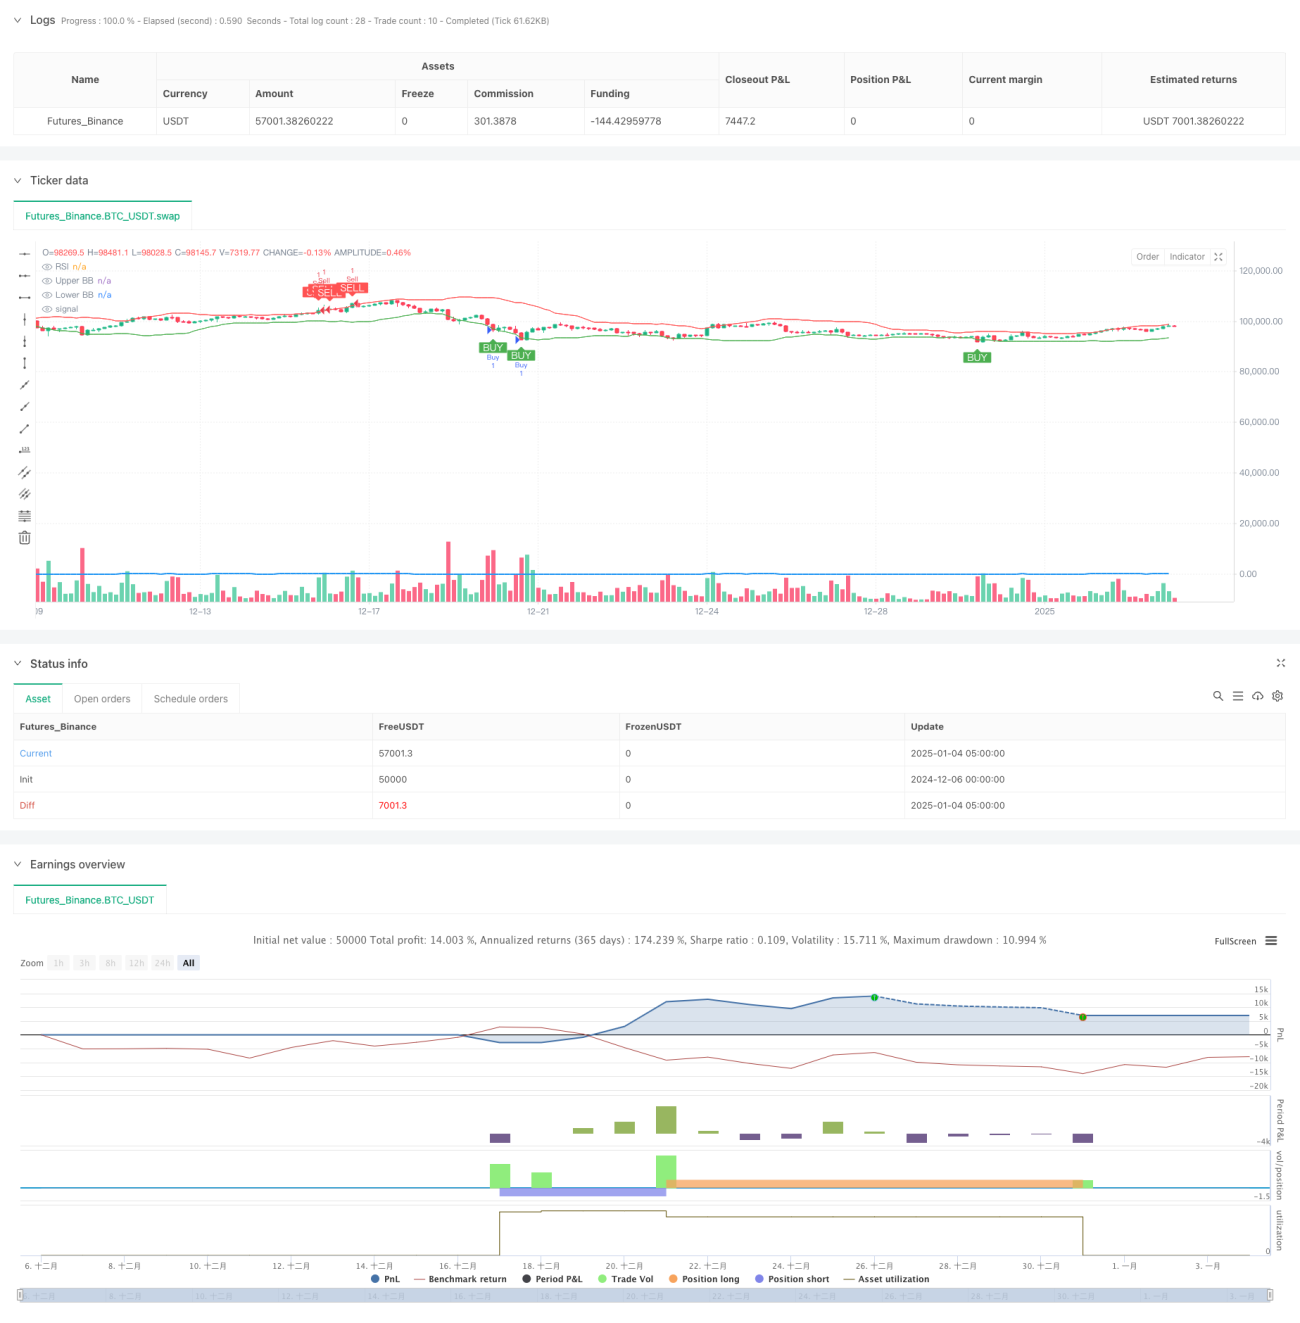
Cette stratégie est un système de trading d'inversion de dynamique qui combine les indicateurs techniques doubles RSI et Bollinger Bands pour trader en identifiant les zones de surachat et de survente. La stratégie utilise un ratio risque/rendement de 1:2 et combine un stop loss mobile pour le contrôle des risques. La logique principale est de négocier lorsque le RSI et les bandes de Bollinger montrent des signaux de surachat ou de survente en même temps, et de protéger les fonds grâce à une gestion stricte des risques.
Principe de stratégie
La stratégie utilise le RSI sur 14 périodes et les bandes de Bollinger sur 20 périodes comme principaux indicateurs. Les conditions d'achat doivent être remplies simultanément : le RSI est inférieur à 30 (survendu) et le prix touche ou descend en dessous de la bande de Bollinger inférieure. Les conditions de vente doivent être remplies en même temps : le RSI est supérieur à 70 (surachat) et le prix touche ou dépasse la bande de Bollinger supérieure. Le système utilise le point le plus haut/le plus bas des 5 lignes K comme stop loss mobile, et la position de take-profit est deux fois plus éloignée du stop loss, mettant en œuvre strictement un ratio risque/rendement de 1:2.
Avantages stratégiques
- Le filtrage à double indice technique améliore la qualité du signal et réduit les faux signaux
- Combiner des indicateurs de momentum et de volatilité pour offrir une perspective de marché plus complète
- Mécanisme de contrôle des risques strict, comprenant un stop loss suiveur et un ratio risque/rendement fixe
- Le système est entièrement automatisé, éliminant ainsi toute interférence émotionnelle humaine
- La logique de la stratégie est claire, facile à comprendre et à maintenir
Risque stratégique
- Les stop loss peuvent être fréquents sur les marchés en tendance
- Les conditions doubles peuvent faire manquer certaines opportunités de trading
- Les paramètres RSI fixes et les bandes de Bollinger peuvent ne pas convenir à tous les environnements de marché
- Les stops suiveurs peuvent conduire à des sorties prématurées sur des marchés volatils
- Une gestion financière raisonnable est nécessaire pour faire face aux pertes consécutives
Orientation de l'optimisation de la stratégie
- Introduire un mécanisme de paramètres adaptatifs pour ajuster dynamiquement les paramètres de l'indicateur en fonction de la volatilité du marché
- Ajout d'un filtre de tendance pour suspendre les échanges inversés dans les tendances fortes
- Développer un système dynamique de ratio risque-rendement et l'ajuster en fonction des conditions du marché
- Ajoutez un mécanisme de confirmation du volume pour améliorer la fiabilité du signal
- Mettre en œuvre des mécanismes de stop loss plus flexibles, tels que le stop loss suiveur ou le stop loss temporel
Résumer
Il s'agit d'une stratégie de trading inversée bien structurée qui utilise des indicateurs techniques doubles pour une précision accrue et emploie une gestion stricte des risques. Bien que la stratégie soit simple et intuitive, elle contient les éléments clés requis pour un système de trading mature. Grâce aux orientations d’optimisation suggérées, cette stratégie peut encore être améliorée. Dans le trading réel, il est recommandé d’effectuer d’abord des backtests et une optimisation des paramètres suffisants.
- 1