Suivi des tendances des prix et des volumes à haute fréquence et stratégie adaptative d'analyse des volumes

Aperçu
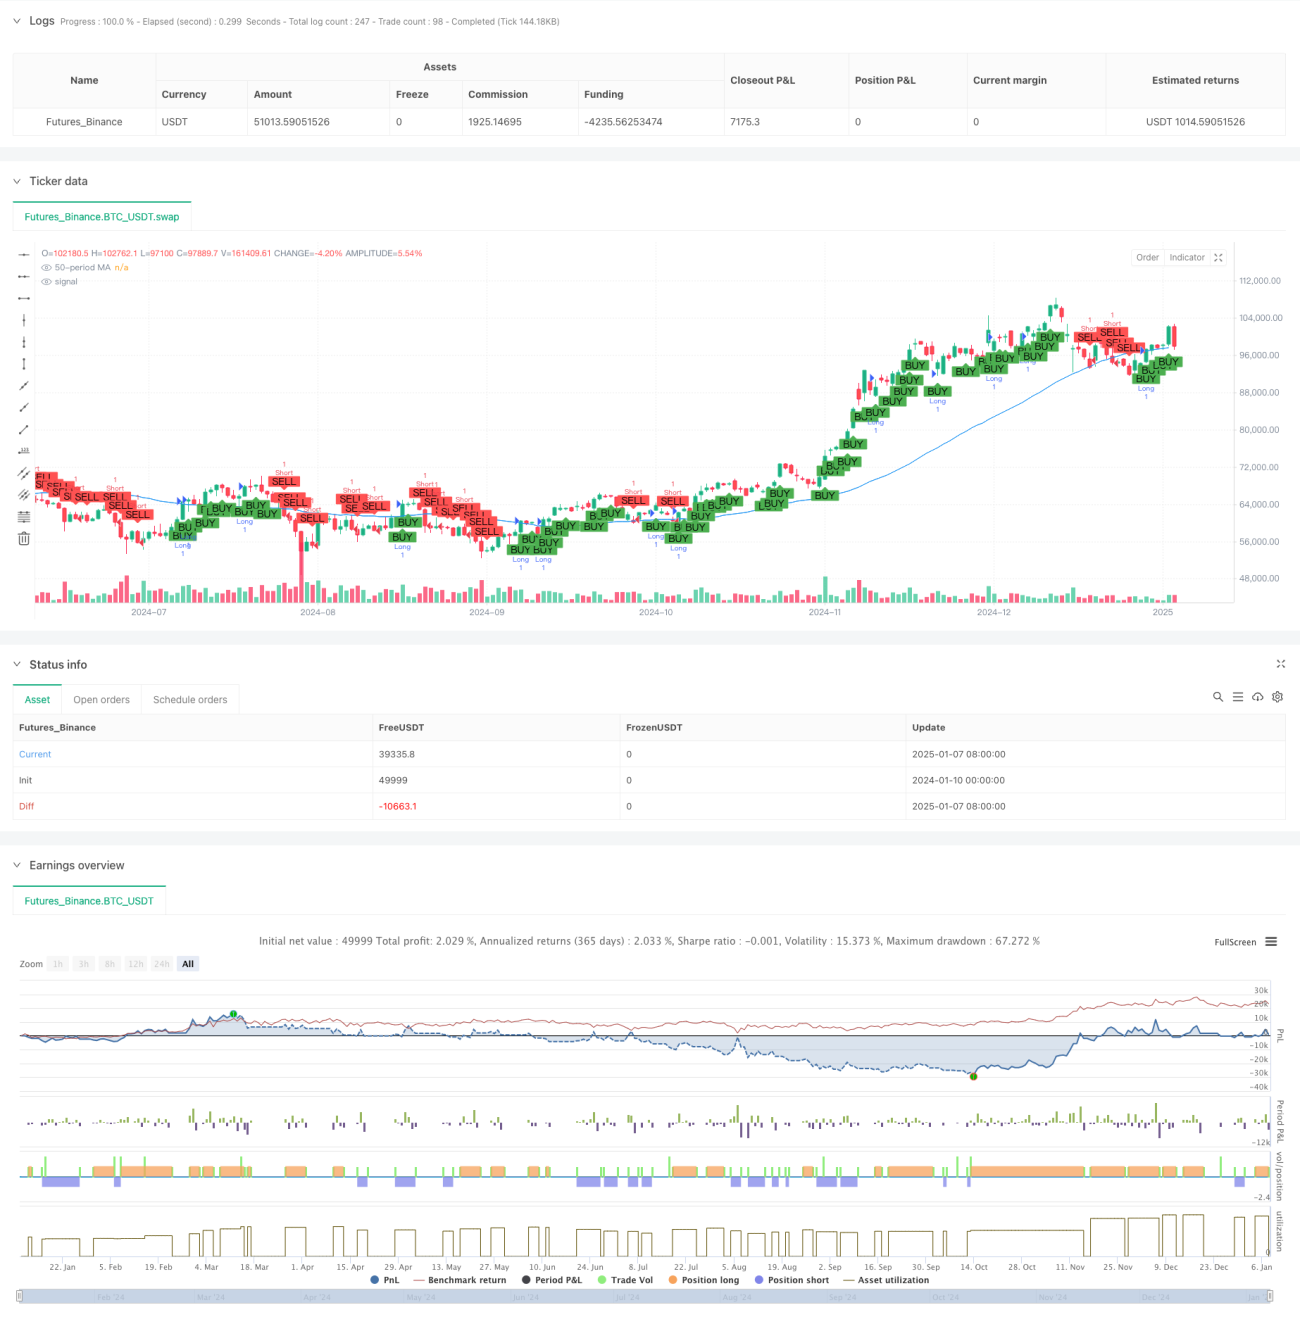
La stratégie est un système de trading automatisé basé sur une période de 5 minutes qui combine des méthodes de suivi de tendance de moyenne mobile et d'analyse du volume. La stratégie utilise une moyenne mobile simple (SMA) sur 50 périodes pour déterminer les tendances du marché et introduit une analyse du volume pour vérifier la validité des signaux de trading. Le système utilise des objectifs de stop loss et de profit fixes pour réaliser un trading entièrement automatisé.
Principe de stratégie
La logique fondamentale de la stratégie comprend les éléments clés suivants :
- Identification des tendances : utilisez la moyenne mobile sur 50 périodes pour déterminer la direction du marché. Lorsque le cours de clôture est supérieur à la moyenne mobile, on parle de tendance à la hausse, sinon, on parle de tendance à la baisse. Dans le même temps, la tendance des prix au cours des 30 dernières minutes (6 lignes K) est combinée pour confirmer la tendance.
- Analyse du volume : calculez le volume d'achat et de vente en fonction des fluctuations de prix et répartissez le volume dans chaque ligne K en volume d'achat et volume de vente en fonction de la position du prix de clôture.
- Génération de signaux de trading : Dans une tendance à la hausse, un signal long est généré lorsque le volume d'achat est supérieur au volume de vente ; dans une tendance à la baisse, un signal court est généré lorsque le volume de vente est supérieur au volume d'achat.
- Contrôle des risques : utilisez un stop loss de 3 % et un objectif de profit de 29 % pour gérer le rapport risque/récompense de chaque transaction.
Avantages stratégiques
- Confirmation de tendance multidimensionnelle : en combinant la moyenne mobile et les tendances des prix à court terme pour doubler la tendance, la précision du jugement de tendance est améliorée.
- Vérification du volume : introduisez l'analyse du volume comme filtre de signal de trading pour éviter les fausses cassures dans un environnement à faible volume.
- Gestion parfaite des risques : définissez des objectifs clairs de stop loss et de profit pour contrôler efficacement le risque d'une transaction unique.
- Forte adaptabilité : la stratégie peut ajuster automatiquement la direction de la transaction en fonction de l'état du marché et s'adapter à différents environnements de marché.
Risque stratégique
- Risque de marché volatil : de faux signaux de rupture fréquents peuvent se produire dans un marché latéral et volatil, entraînant des stop loss continus.
- Risque de dérapage : dans le trading à haute fréquence, vous pouvez être confronté à un dérapage important, ce qui affectera l'effet d'exécution réel.
- Sensibilité des paramètres : L’effet de la stratégie est sensible à des paramètres tels que la période de moyenne mobile et la période de calcul du volume de transactions.
- Dépendance à l’environnement de marché : la stratégie fonctionne bien sur un marché avec une tendance claire, mais peut subir des baisses importantes pendant les périodes de transition de tendance.
Orientation de l'optimisation de la stratégie
- Optimisation des paramètres dynamiques : un mécanisme de paramètres adaptatif peut être introduit pour ajuster dynamiquement la période de moyenne mobile et la période de calcul du volume de transactions en fonction de la volatilité du marché.
- Augmentez le filtrage de l'environnement du marché : ajoutez des indicateurs de volatilité ou des indicateurs de force de tendance pour arrêter automatiquement le trading dans des conditions de marché inappropriées.
- Améliorer le mécanisme de stop-loss : un stop-loss dynamique, tel qu'un stop-loss suiveur ou un stop-loss basé sur l'ATR, peut être utilisé pour augmenter la flexibilité du contrôle des risques.
- Optimisez la logique de génération de signaux : envisagez d'ajouter davantage d'indicateurs techniques pour la validation croisée afin d'améliorer la fiabilité du signal.
Résumer
Cette stratégie construit un système de trading haute fréquence complet en combinant le suivi des tendances et l'analyse du volume. Les principaux avantages de la stratégie résident dans son mécanisme de confirmation du signal multidimensionnel et son système de contrôle des risques parfait. Bien qu’il existe certains risques inhérents, la stabilité et l’adaptabilité de la stratégie peuvent être encore améliorées grâce aux orientations d’optimisation proposées. La stratégie est particulièrement adaptée pour opérer dans un environnement de marché avec des tendances claires et devrait permettre d'obtenir des résultats de trading stables grâce à une optimisation raisonnable des paramètres et à une gestion des risques.
/*backtest
start: 2024-01-10 00:00:00
end: 2025-01-08 08:00:00
period: 1d
basePeriod: 1d
exchanges: [{"eid":"Futures_Binance","currency":"BTC_USDT","balance":49999}]
*/

// This Pine Script™ code is subject to the terms of the Mozilla Public License 2.0 at https://mozilla.org/MPL/2.0/
// © Jerryorange

//@version=6- 1