
Aperçu
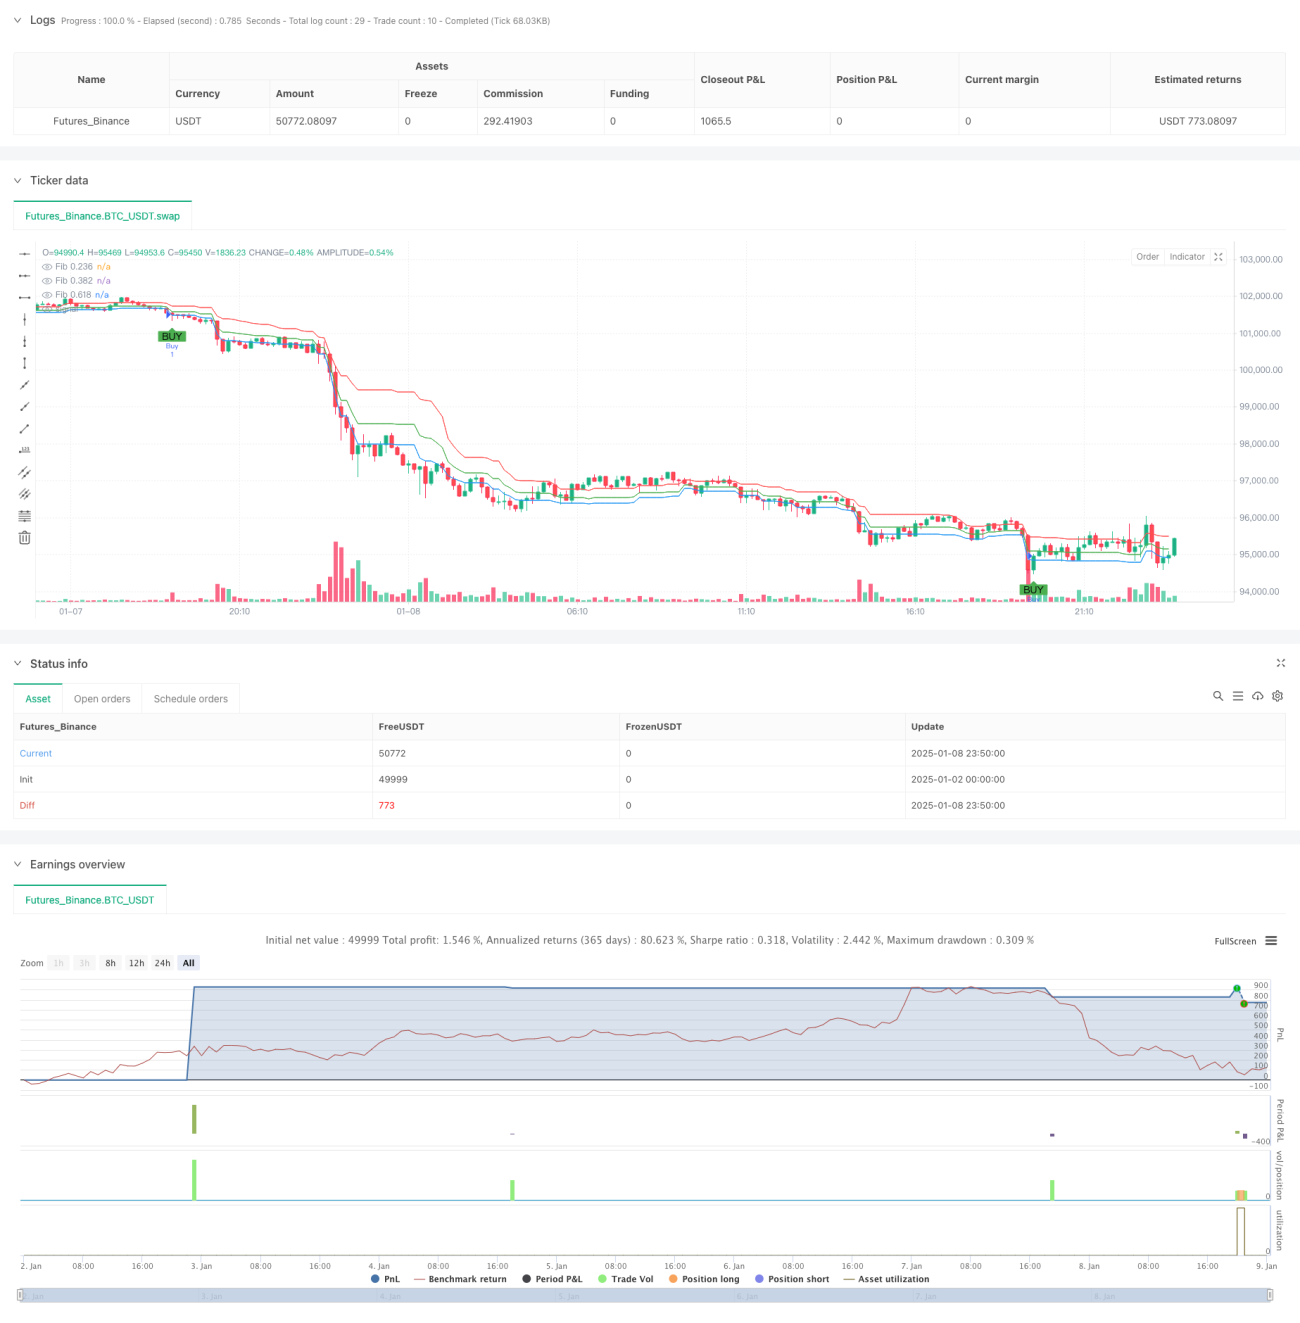
Cette stratégie est un système de day trading qui combine les bandes de Bollinger et les niveaux de retracement de Fibonacci. Il utilise l'indicateur des bandes de Bollinger pour identifier les conditions de surachat et de survente, tout en utilisant les niveaux de retracement de Fibonacci pour confirmer les niveaux de support et de résistance potentiels, capturant ainsi les opportunités de trading dans les fluctuations du marché. La stratégie utilise des bandes de Bollinger de 20 périodes et trois niveaux clés de Fibonacci de 0,236, 0,382 et 0,618 pour la génération de signaux.
Principe de stratégie
La logique fondamentale de la stratégie repose sur les éléments clés suivants :
- Utilisez les bandes de Bollinger supérieure et inférieure (l'écart type est de 2) pour marquer les zones de surachat et de survente des prix
- Calculez le niveau de retracement de Fibonacci en utilisant les prix les plus élevés et les plus bas des 20 dernières périodes
- Un signal d'achat est généré lorsque le prix dépasse la bande de Bollinger inférieure et les niveaux de support de Fibonacci 0,236 ou 0,382
- Un signal de vente est généré lorsque le prix dépasse la bande de Bollinger supérieure et passe en dessous du niveau de résistance de Fibonacci 0,618.
- Utilisez des points de stop loss et de take profit fixes pour contrôler le risque et verrouiller les bénéfices
Avantages stratégiques
- Combiné au double mécanisme de confirmation de tendance et de support et résistance, la fiabilité des signaux de trading est améliorée
- Les bandes de Bollinger peuvent s'adapter de manière dynamique aux changements de volatilité du marché, ce qui rend la stratégie hautement adaptable
- Les niveaux de Fibonacci fournissent un cadre de référence clair pour les entrées et les sorties
- Les paramètres fixes de stop loss et de take profit aident à contrôler strictement les risques
- Les paramètres de stratégie peuvent être ajustés de manière flexible en fonction des différentes conditions du marché
Risque stratégique
- De faux signaux de rupture fréquents peuvent se produire sur un marché volatil
- Les paramètres de stop loss et de take profit fixes peuvent ne pas convenir à toutes les conditions de marché
- L'efficacité des niveaux de Fibonacci est grandement affectée par la structure du marché
- Sur les marchés à évolution rapide, certains mouvements du marché peuvent être manqués
- Les paramètres doivent être surveillés et ajustés en permanence pour s'adapter aux changements du marché
Orientation de l'optimisation de la stratégie
- Présentation des indicateurs de volume pour confirmer la validité de la cassure
- Ajustez dynamiquement les niveaux de stop loss et de take profit en fonction de la volatilité du marché
- Filtre de tendance ajouté pour éviter de négocier sur des marchés latéraux
- Optimisation de la période de calcul des niveaux de Fibonacci
- Pensez à ajouter des filtres temporels pour éviter de négocier pendant les périodes de faible liquidité
Résumer
Il s'agit d'un système de trading complet qui combine les outils classiques de l'analyse technique, offrant aux traders un cadre de trading systématique grâce à la synergie des bandes de Bollinger et des retracements de Fibonacci. Bien qu'il existe certaines limites, cette stratégie peut bien fonctionner dans le trading intraday grâce à une optimisation appropriée des paramètres et à une gestion des risques. La clé est de procéder aux ajustements et optimisations correspondants en fonction des produits de trading spécifiques et des conditions du marché.
- 1