
Aperçu
Il s'agit d'une stratégie de trading quantitatif combinant l'indice de force relative (RSI) et plusieurs moyennes mobiles. La stratégie détermine principalement la tendance du marché en surveillant les signaux de croisement de différents types de moyennes mobiles (SMA, EMA, WMA et SMMA) sur l'indicateur RSI, tout en utilisant les zones de surachat et de survente du RSI comme aide à la décision pour déterminer les moments d'entrée et de sortie.
Principe de la stratégie
La stratégie comprend principalement les étapes de calcul clés suivantes :
- Calculer le RSI sur 14 périodes, avec une zone de surachat fixée à 70 et une zone de survente à 30.
- Calculer trois moyennes mobiles avec différents paramètres sur la courbe RSI :
- MA1 : 20 périodes, options : SMA/EMA/WMA/SMMA
- MA2 : 50 périodes, options : SMA/EMA/WMA/SMMA
- MA3 : 100 périodes, options : SMA/EMA/WMA/SMMA
- Règles de génération des signaux de trading :
- Signal d'achat : lorsque MA2 croise MA3 à la hausse
- Signal de vente : lorsque MA2 croise MA3 à la baisse
- Détection simultanée des divergences du RSI pour fournir une référence auxiliaire pour les décisions de trading.
Avantages de la stratégie
- Validation croisée de multiples indicateurs techniques, améliorant la fiabilité des signaux de trading.
- Types et paramètres des moyennes mobiles ajustables, offrant une grande flexibilité.
- La fonction de détection des divergences du RSI peut aider à anticiper les points de retournement du marché.
- Gestion de la taille des positions en pourcentage, permettant un contrôle efficace des risques.
- Excellente visualisation, facilitant l'analyse et le backtesting.
Risques de la stratégie
- Les croisements de moyennes mobiles peuvent produire un effet de retard.
- Dans un marché stagnant (range), ils peuvent générer de faux signaux fréquents.
- Distorsion de l'indicateur RSI dans certaines conditions de marché.
- Un mauvais choix de paramètres peut entraîner un nombre excessif ou insuffisant de signaux de trading.
Mesures d'atténuation :
- Il est recommandé de croiser les signaux avec les tendances du marché et le volume des transactions.
- Optimiser la fréquence des transactions en ajustant les paramètres des moyennes mobiles.
- Mettre en place des stops loss et des take profit pour contrôler les risques.
Pistes d'optimisation de la stratégie
- Optimisation du filtrage des signaux :
- Ajouter des indicateurs de confirmation de tendance.
- Intégrer l'analyse du volume.
- Optimisation dynamique des paramètres :
- Ajuster automatiquement les paramètres RSI et MA en fonction de la volatilité du marché.
- Introduire des méthodes de calcul de périodes adaptatives.
- Optimisation du contrôle des risques :
- Développer des mécanismes de stop loss et take profit dynamiques.
- Concevoir un système de gestion dynamique de la taille des positions.
Conclusion
Cette stratégie construit un système de trading très adaptable en combinant le RSI et plusieurs moyennes mobiles. Le principal avantage de la stratégie réside dans la validation croisée de multiples indicateurs techniques et la flexibilité des paramètres. Cependant, il faut tenir compte du retard des moyennes mobiles et de l'impact des conditions de marché sur les performances de la stratégie. Grâce à une optimisation continue et à un contrôle des risques, cette stratégie pourrait obtenir des performances stables dans le trading réel.
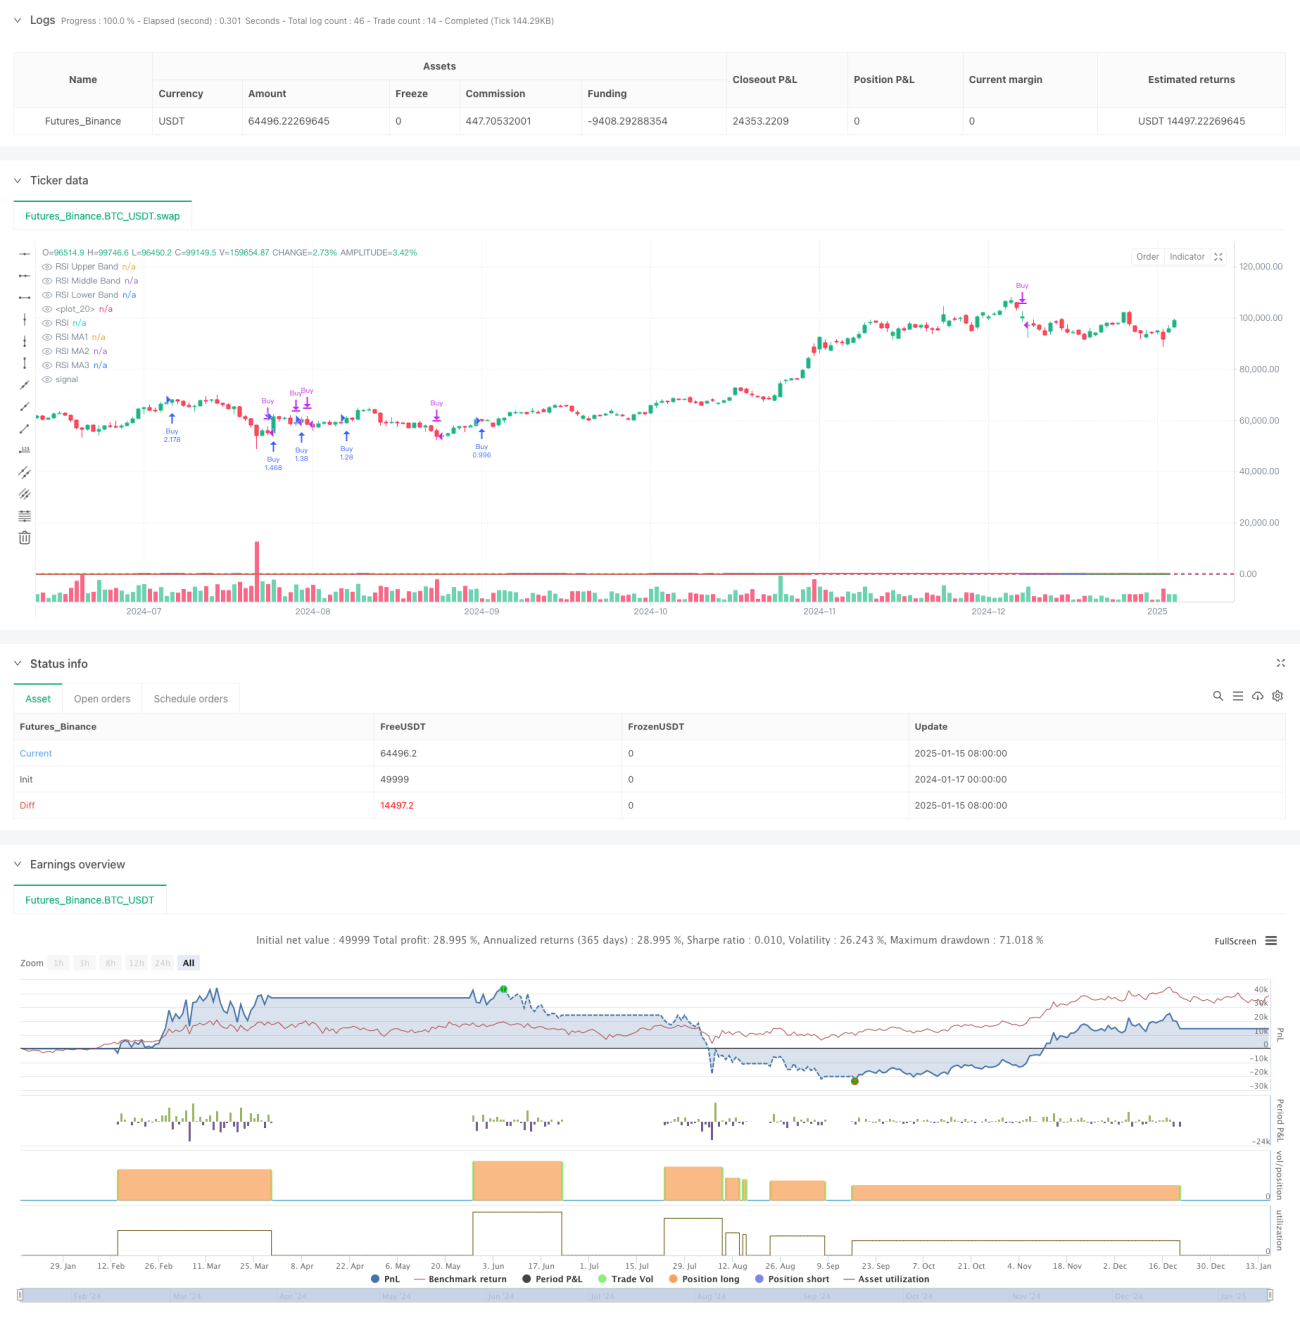
/*backtest
start: 2024-01-17 00:00:00
end: 2025-01-16 00:00:00
period: 1d
basePeriod: 1d
exchanges: [{"eid":"Futures_Binance","currency":"BTC_USDT","balance":49999}]
*/

//@version=6
strategy(title="Relative Strength Index with MA Strategy", shorttitle="RSI-MA Strategy", overlay=true, default_qty_type=strategy.percent_of_equity, default_qty_value=200)

// RSI Inputs- 1