Stratégie de trading dynamique RSI avec tendance moyenne mobile exponentielle améliorée

Aperçu
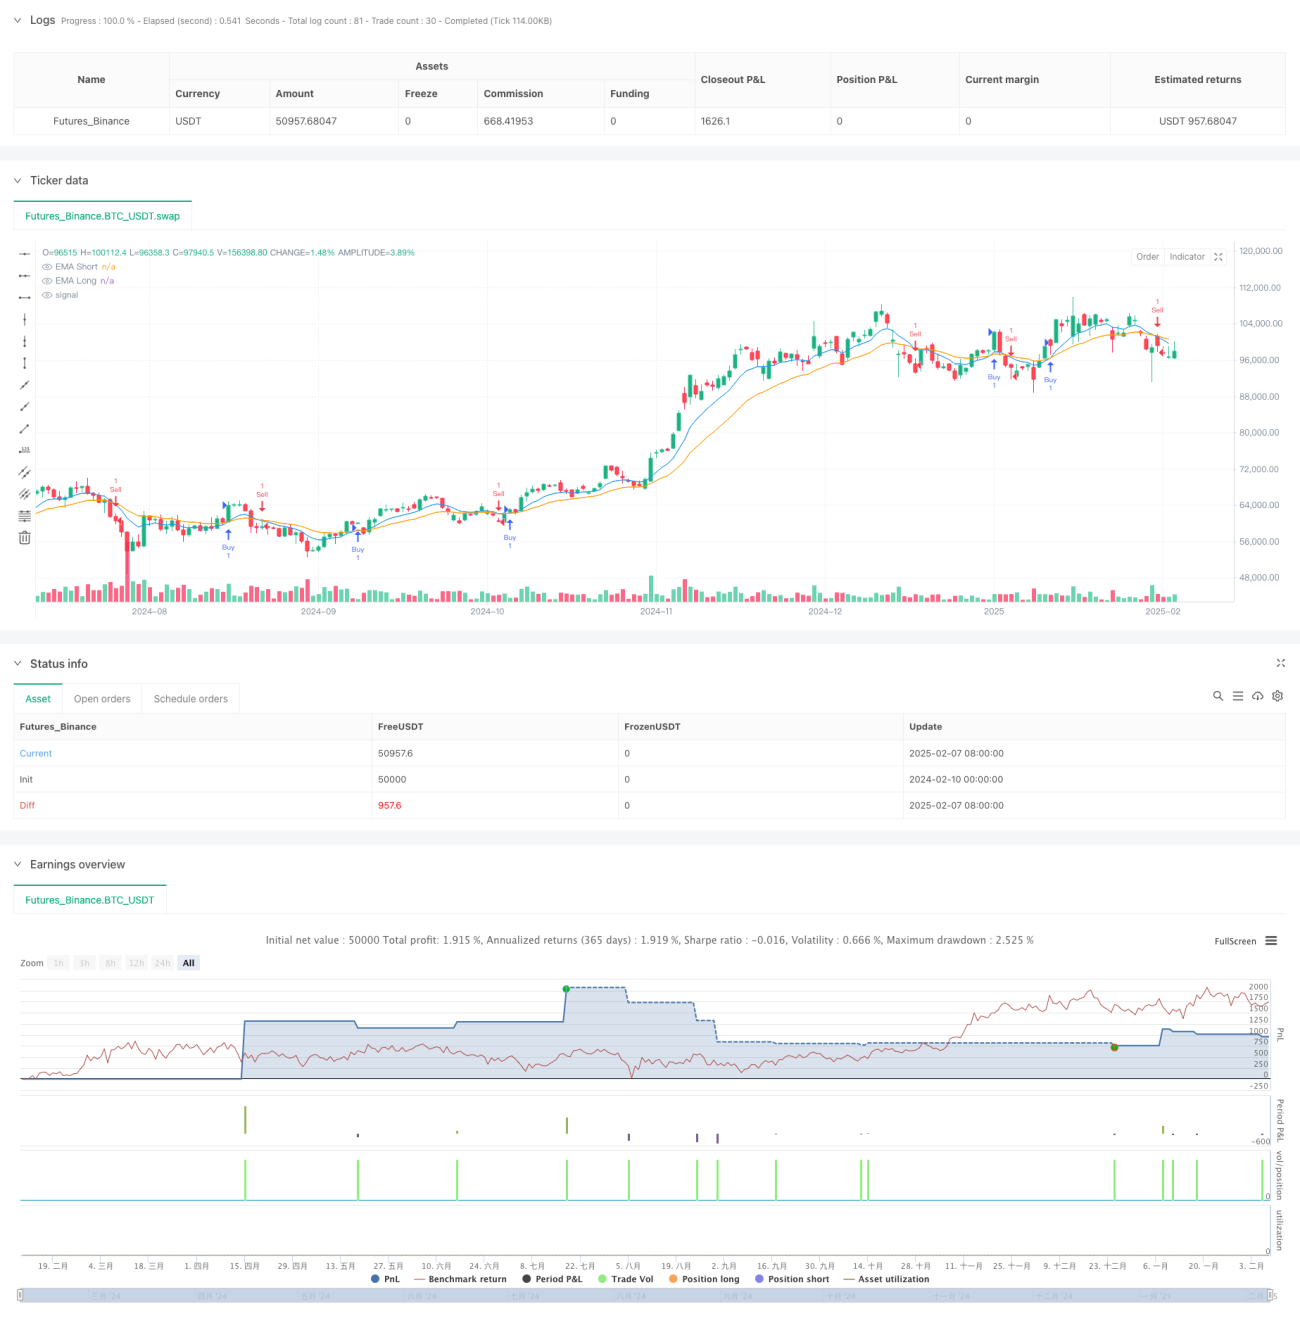
La stratégie est un système de suivi de la tendance dynamique combinant une moyenne mobile indicielle (EMA) et un indicateur relativement faible (RSI). Elle identifie la direction de la tendance à travers un croisement des EMA de 9 cycles et de 21 cycles et utilise le RSI comme indicateur de confirmation de tendance. La stratégie comprend également un système de gestion de fonds complet, y compris la définition d'objectifs de stop-loss et de gain dynamiques.
Principe de stratégie
La logique fondamentale de la stratégie repose sur les éléments clés suivants :
- Utilisez un croisement de l'EMA à court terme (cycle 9) et à long terme (cycle 21) pour capturer les changements de tendance
- La confirmation de la tendance est effectuée à l'aide de l'indicateur RSI à 14 cycles, ce qui nécessite un effet de levier lorsque le RSI est supérieur à 50 et un effet de levier lorsque le RSI est inférieur à 50
- La taille de la position est calculée en fonction de la dynamique du montant du risque, avec un arrêt de perte de 30 points par défaut.
- Calcul dynamique du prix cible de profit à l'aide des paramètres de gestion de fonds
- Affichage en temps réel des marqueurs d'entrée, des prix cibles et des positions de stop loss sur le graphique
Avantages stratégiques
- La combinaison de l'indicateur de tendance et de la dynamique améliore la fiabilité des signaux de trading
- Système de gestion complète des fonds, adapté au risque en fonction de la taille du compte
- Système de rétroaction visuel clair, incluant les marqueurs de défaillance de la transaction
- Les paramètres sont entièrement personnalisables pour s'adapter à différents styles de trading
- Automatisation de l'entrée et de la sortie et réduction de l'intervention humaine
Risque stratégique
- L'EMA comme indicateur de retard peut produire un signal de retard dans un marché très volatil
- De fréquents faux signaux de rupture peuvent se produire dans un marché latéral
- Les stop-loss à points fixes peuvent ne pas être assez flexibles avec les variations de volatilité
- Les paramètres doivent être soigneusement ajustés pour s'adapter aux différentes conditions du marché.
- Risque de glissement potentiel dans un environnement à faible liquidité
Orientation de l'optimisation de la stratégie
- L'introduction de mécanismes d'arrêt adaptatifs, tels que l'arrêt dynamique basé sur l'ATR
- Ajout d'un filtre de volatilité du marché et ajustement des paramètres de stratégie pendant les périodes de forte volatilité
- Ajoutez un filtrage des heures de transaction pour éviter de négocier à des heures défavorables
- Développer un système de gestion de position plus intelligent, en tenant compte de la volatilité du marché
- L'introduction d'indicateurs supplémentaires pour filtrer les faux signaux
Résumer
La stratégie crée un système complet de suivi des tendances en combinant les confirmations EMA croisées et RSI. Son principal avantage réside dans la combinaison organique de l'analyse technique et de la gestion des risques, avec une bonne évolutivité et une bonne adaptabilité. Bien qu'il existe des risques inhérents, la stratégie peut fournir aux traders un cadre de trading robuste grâce à une optimisation continue et à un ajustement des paramètres.
- 1