Stratégie de trading d'optimisation de la plage de surachat et de survente avec croisement de moyennes mobiles doubles et RSI stochastique

Aperçu
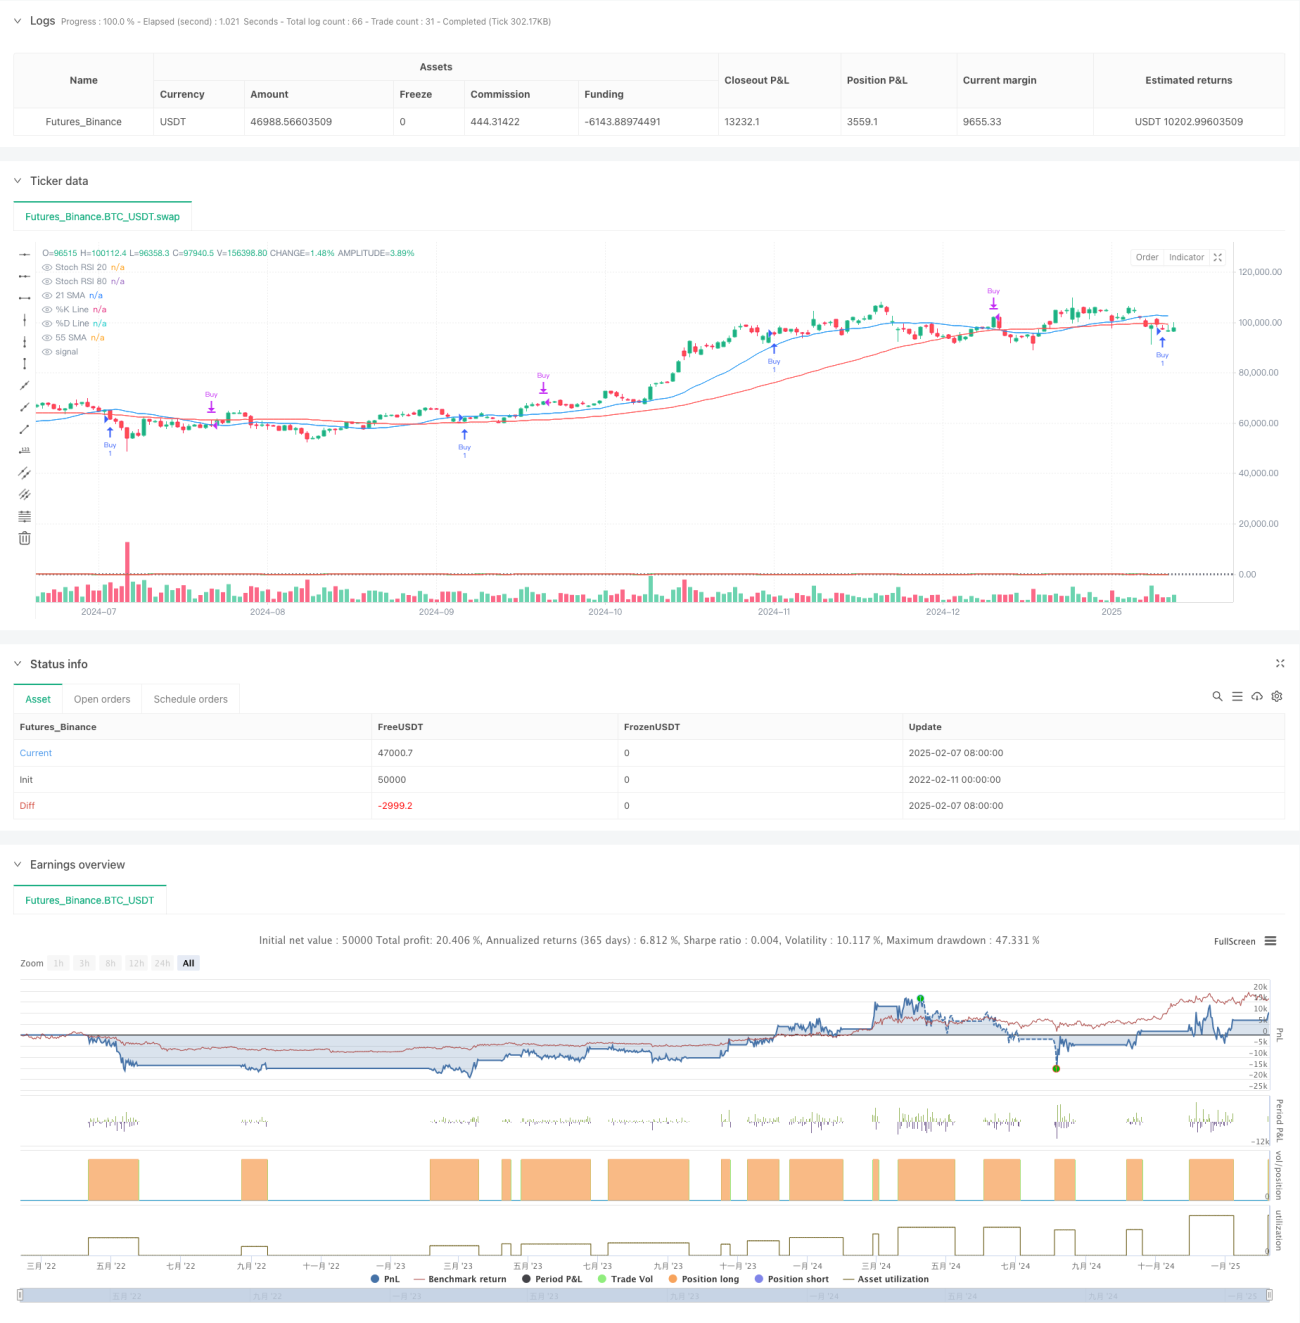
La stratégie est un système de trading de suivi de tendance combinant une ligne de bi-mesure et un indicateur RSI aléatoire. Elle juge la tendance du marché à l'aide d'une moyenne mobile simple à 21 cycles et à 55 cycles. Elle utilise le RSI aléatoire pour trouver les meilleurs points d'entrée et de sortie dans les zones de survente et de survente.
Principe de stratégie
La stratégie est basée sur la logique suivante:
- Confirmation de la tendance: avec les SMA de 21 cycles et les SMA de 55 cycles, une tendance à la hausse est confirmée lorsque la moyenne à court terme est au-dessus de la moyenne à long terme.
- Signal d'entrée: après confirmation de la tendance, la ligne K du RSI au hasard se forme une croix dorée avec la ligne D dans la zone de survente inférieure à 20.
- Signal de sortie: Sortie de la position de placement lorsque la ligne K du RSI au hasard forme un croisement mort avec la ligne D dans une zone de survente supérieure à 80.
- Filtrage des signaux: réduire efficacement les faux signaux en combinant les indicateurs de tendance et de dynamique.
Avantages stratégiques
- Mécanisme de double confirmation: améliorer la fiabilité des transactions grâce à la double confirmation des tendances et des dynamiques.
- Optimisation du contrôle des risques: utilisation de la zone de survente pour choisir un point d'entrée plus favorable dans la direction de la tendance.
- Adaptabilité: les paramètres de la stratégie peuvent être ajustés en fonction des caractéristiques du marché.
- Les signaux sont clairs: les conditions d'entrée et de sortie sont claires et faciles à mettre en œuvre.
- Un degré élevé de systématisation: la logique stratégique est complètement systématisée, réduisant les jugements subjectifs.
Risque stratégique
- Risque de choc: les transactions peuvent être fréquentes sur les marchés à choc horizontal.
- Risque de retard: les moyennes mobiles ont un certain retard et risquent de manquer le meilleur moment d'entrée.
- Risque de fausse rupture: le RSI aléatoire peut générer de faux signaux dans un marché en crise.
- Sensibilité des paramètres : différentes combinaisons de paramètres peuvent entraîner de grandes différences dans les performances de la stratégie.
Orientation de l'optimisation de la stratégie
- Ajout d'un filtre sur la volatilité: l'introduction de l'indicateur ATR réduit la fréquence des transactions pendant les périodes de faible volatilité.
- Optimisation du mécanisme de sortie: inclusion d'objectifs de stop loss ou de profit mobiles.
- Classification des environnements de marché: paramètres ajustés en fonction de la dynamique des différents environnements de marché.
- Augmentation de la confirmation de transaction: ajout d'un indicateur de transaction pour vérifier l'efficacité du signal.
- L'introduction d'indicateurs de force de tendance, tels que l'ADX, est utilisée pour filtrer les environnements de tendance faible.
Résumer
La stratégie, combinée à des indicateurs techniques classiques, construit un système de trading complet de suivi des tendances. La stratégie, tout en restant simple et intuitive, améliore la fiabilité grâce à la confirmation de signaux multiples. La stratégie a une bonne valeur pratique grâce à une optimisation des paramètres et une gestion des risques raisonnables.
- 1