
Aperçu
La stratégie est un système de trading de suivi de tendance innovant qui utilise la technologie de l'aplatissement de l'indice à deux niveaux pour identifier les tendances du marché. Le système génère deux lignes de tendance en traitant les données de prix avec un aplatissement de l'indice spécial pour capturer les mouvements à court et à long terme du marché. Le système intègre un module complet de gestion des risques, comprenant des paramètres d'arrêt et de perte, ainsi que des fonctions de gestion de position flexibles.
Principe de stratégie
Le cœur de la stratégie est son algorithme unique de lissage à deux couches. Tout d'abord, le système traite les prix de clôture avec un traitement pondéré, calculé comme suit:*Le système génère un signal de transaction lorsque la courbe à court terme traverse la courbe à long terme. Le système génère des signaux de multiplication et de rupture lorsque la courbe à court terme traverse la courbe à long terme. Le système contient également un système de gestion de position basé sur le pourcentage, qui utilise par défaut 100% des fonds du compte pour les transactions.
Avantages stratégiques
- Les mécanismes de génération de signaux sont clairs, utilisent les concepts classiques de suivi des tendances et sont faciles à comprendre et à exécuter.
- La technologie de l'aplatissement à deux couches permet de filtrer efficacement le bruit du marché et d'améliorer la qualité du signal.
- Un système complet de gestion des risques est intégré, y compris le stop loss et la gestion des positions.
- Le système peut s'adapter à différents environnements de marché et s'appliquer à de nombreuses variétés de transactions.
- Il fournit des indicateurs visuels clairs qui aident les traders à déterminer rapidement la direction du marché.
Risque stratégique
- Les faux signaux peuvent être fréquents dans les marchés en crise, entraînant des pertes continues.
- Par défaut, les transactions sont effectuées avec 100% de fonds, un taux de levier trop élevé peut entraîner un risque plus élevé.
- Les paramètres de stop-loss avec des points fixes peuvent ne pas être adaptés à tous les environnements de marché.
- Le système peut avoir des points de glissement dans un marché très volatile, ce qui peut affecter l'efficacité de l'exécution.
- Les résultats des tests antérieurs ne garantissent pas les performances futures.
Orientation de l'optimisation de la stratégie
- L'introduction d'indicateurs de volatilité (comme l'ATR) pour ajuster dynamiquement le point d'arrêt.
- Augmentation des filtres d'intensité de tendance et réduction de la fréquence des transactions dans un environnement de tendance faible.
- Ajout d'un module de reconnaissance de l'environnement du marché pour ajuster automatiquement les paramètres de la stratégie en cas de choc.
- Développer un système de gestion de position dynamique qui ajuste automatiquement la taille des transactions en fonction des conditions du marché.
- L'intégration de modules d'analyse fondamentale améliore la précision des décisions de négociation.
Résumer
Il s'agit d'un système de suivi des tendances conçu de manière rationnelle et logique. Grâce à la technique de l'indexation à deux niveaux et à un système complet de gestion des risques, la stratégie peut bien fonctionner dans un marché en tendance. Cependant, les utilisateurs doivent ajuster la taille de leur position en fonction de leur tolérance au risque et il est recommandé de faire une vérification complète avant de négocier en direct.
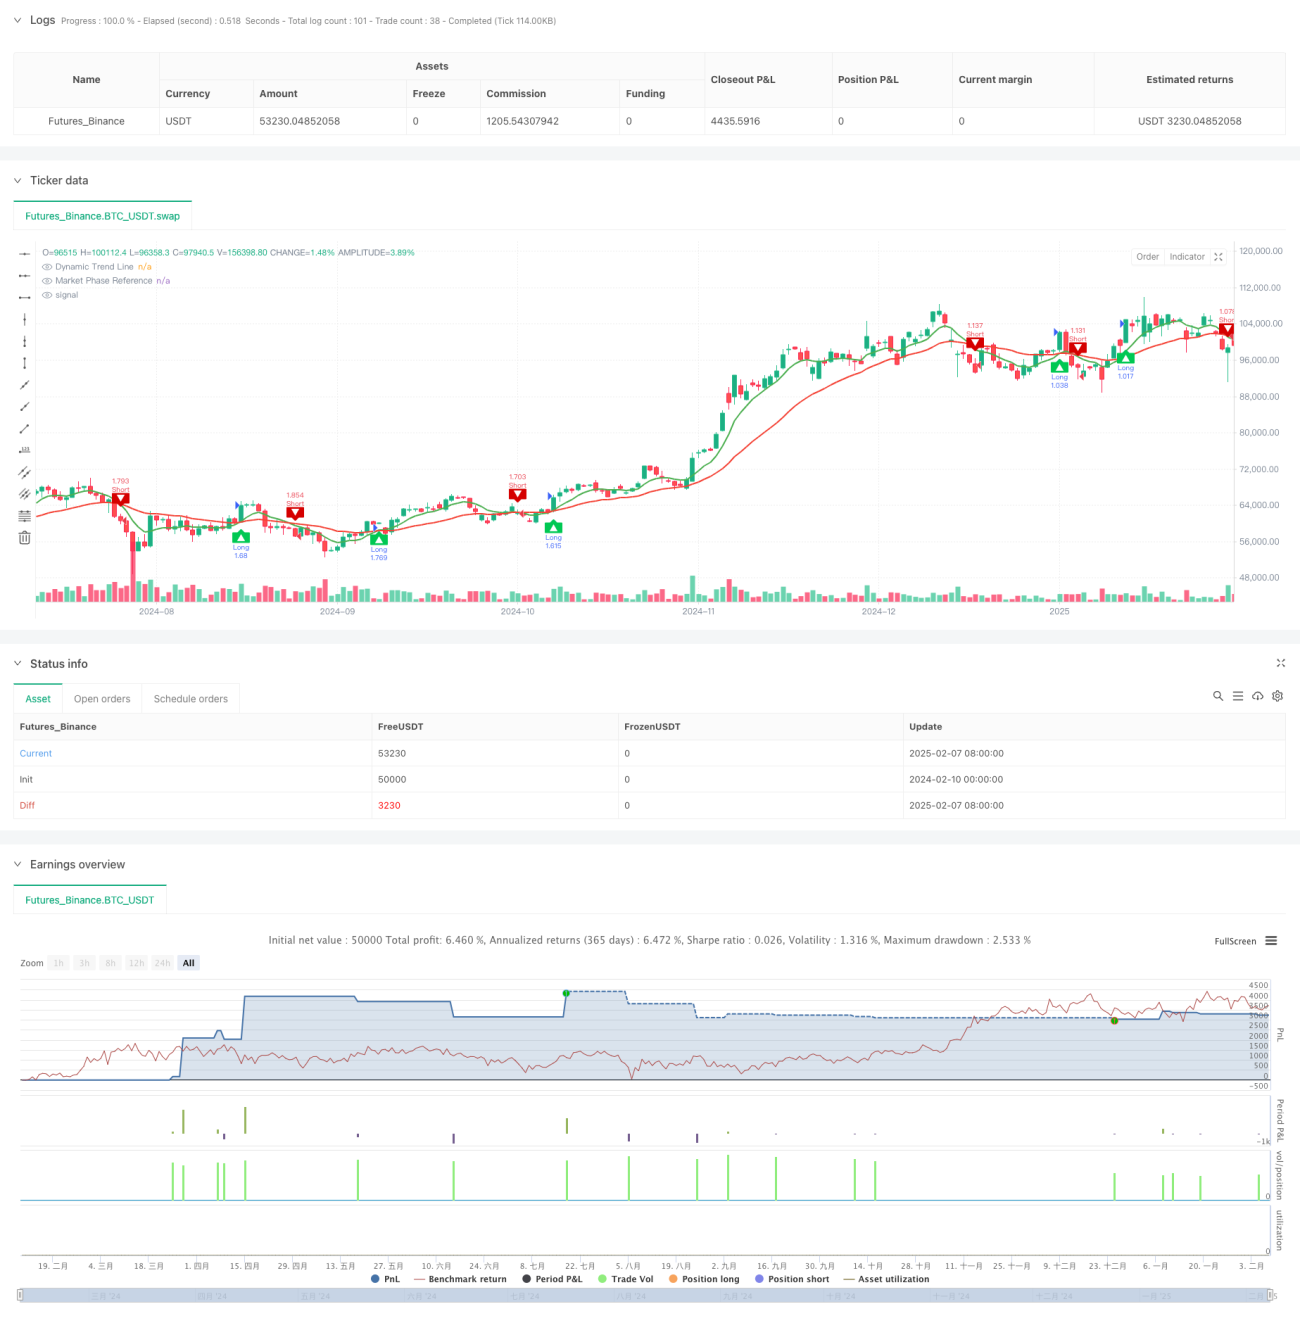
/*backtest
start: 2024-02-10 00:00:00
end: 2025-02-08 08:00:00
period: 1d
basePeriod: 1d
exchanges: [{"eid":"Futures_Binance","currency":"BTC_USDT"}]
*/

//@version=5
strategy("Dynamic Trend Navigator AI [CodingView]", overlay=true, initial_capital=100000, default_qty_type=strategy.percent_of_equity , default_qty_value=200 )
- 1