
Aperçu
La stratégie est un système de suivi de tendance combinant plusieurs indicateurs techniques, qui construit un cadre de décision de négociation complet en intégrant des indicateurs tels que les moyennes mobiles (EMA), les indices de force relative (RSI), les moyennes mobiles de convergence de la dispersion (MACD) et les bandes de bourgeons (BB). La stratégie utilise une approche dynamique de gestion des risques, comprenant des arrêts de perte basés sur le pourcentage et des arrêts de comparaison basés sur les gains de risque, visant à obtenir des gains après ajustement des risques robustes.
Principe de stratégie
La logique centrale de la stratégie est basée sur une analyse de marché à plusieurs niveaux:
- Confirmation de la tendance: utilisation de l'EMA à 200 jours pour déterminer la direction de la tendance à long terme, confirmation croisée des changements de tendance à moyen terme de l'EMA rapide ((20 jours) et de l'EMA lente ((50 jours)
- Vérification de la dynamique: double vérification de la dynamique du marché à l'aide de l'indicateur RSI et du MACD, exigeant que le RSI soit supérieur à 50 (multi-toits) ou inférieur à 50 (toits vides) et que la ligne de signal MACD soutienne la direction correspondante
- Contrôle de la volatilité: saisie précise du moment de la transaction par la bande de Brin, recherche d'opportunités de plus en bas du support de la voie, recherche d'opportunités de moins en haut de la résistance de la voie
- Gestion des risques: un niveau de stop loss de 2% et un niveau de stop loss de 1,5 fois le rapport risque/bénéfice pour assurer la maîtrise des risques de chaque transaction
Avantages stratégiques
- Analyse multidimensionnelle: réduire l'impact des faux signaux en combinant des indicateurs de tendance, de dynamique et de volatilité
- Le contrôle des risques est parfait: les niveaux prédéfinis de stop loss et de stop stop assurent la maîtrise des risques de la transaction
- Adaptabilité: les paramètres de la stratégie peuvent être ajustés en fonction des différentes conditions du marché
- Clarté d'exécution: conditions d'entrée et de sortie claires, faciles à mettre en œuvre et à surveiller
- Gestion raisonnable des fonds: contrôle des positions en utilisant le pourcentage des droits et intérêts des comptes, afin d'éviter les risques excessifs
Risque stratégique
- Risque de fluctuation du marché: risque de déclenchement d'arrêts fréquents en période de forte volatilité
- Risque de renversement de la tendance: un retrait plus important peut se produire à un tournant de la tendance
- Risque d'optimisation des paramètres : une suroptimisation peut conduire à un surapprentissage
- Risque de glissement d'exécution: une plus grande glissement est possible en cas de manque de liquidité
- Risque de frais de commission: les transactions fréquentes peuvent entraîner des coûts de transaction plus élevés
Orientation de l'optimisation de la stratégie
- Ajustement des paramètres dynamiques: les paramètres de l'indicateur peuvent être ajustés automatiquement en fonction des fluctuations du marché
- Augmentation des indicateurs de l'humeur du marché: l'introduction d'indicateurs tels que le volume des transactions améliore la fiabilité du signal
- Optimisation des mécanismes d'arrêt des pertes: réaliser le suivi des pertes et améliorer la protection des bénéfices
- Introduction du filtrage temporel: ajout d'une fenêtre de filtrage pour les heures de négociation
- Ajouter un filtre sur la volatilité: réduire les positions ou suspendre les transactions en période de forte volatilité
Résumer
La stratégie a une bonne adaptabilité et stabilité grâce à une gestion rigoureuse des risques et une analyse de marché multidimensionnelle. Bien qu'il y ait une certaine marge d'optimisation, le cadre global est conçu de manière rationnelle et adaptée à la base de la stratégie de trading à moyen et long terme. La mise en œuvre réussie de la stratégie nécessite une surveillance continue et un ajustement des paramètres en temps opportun pour s'adapter à différents environnements de marché.
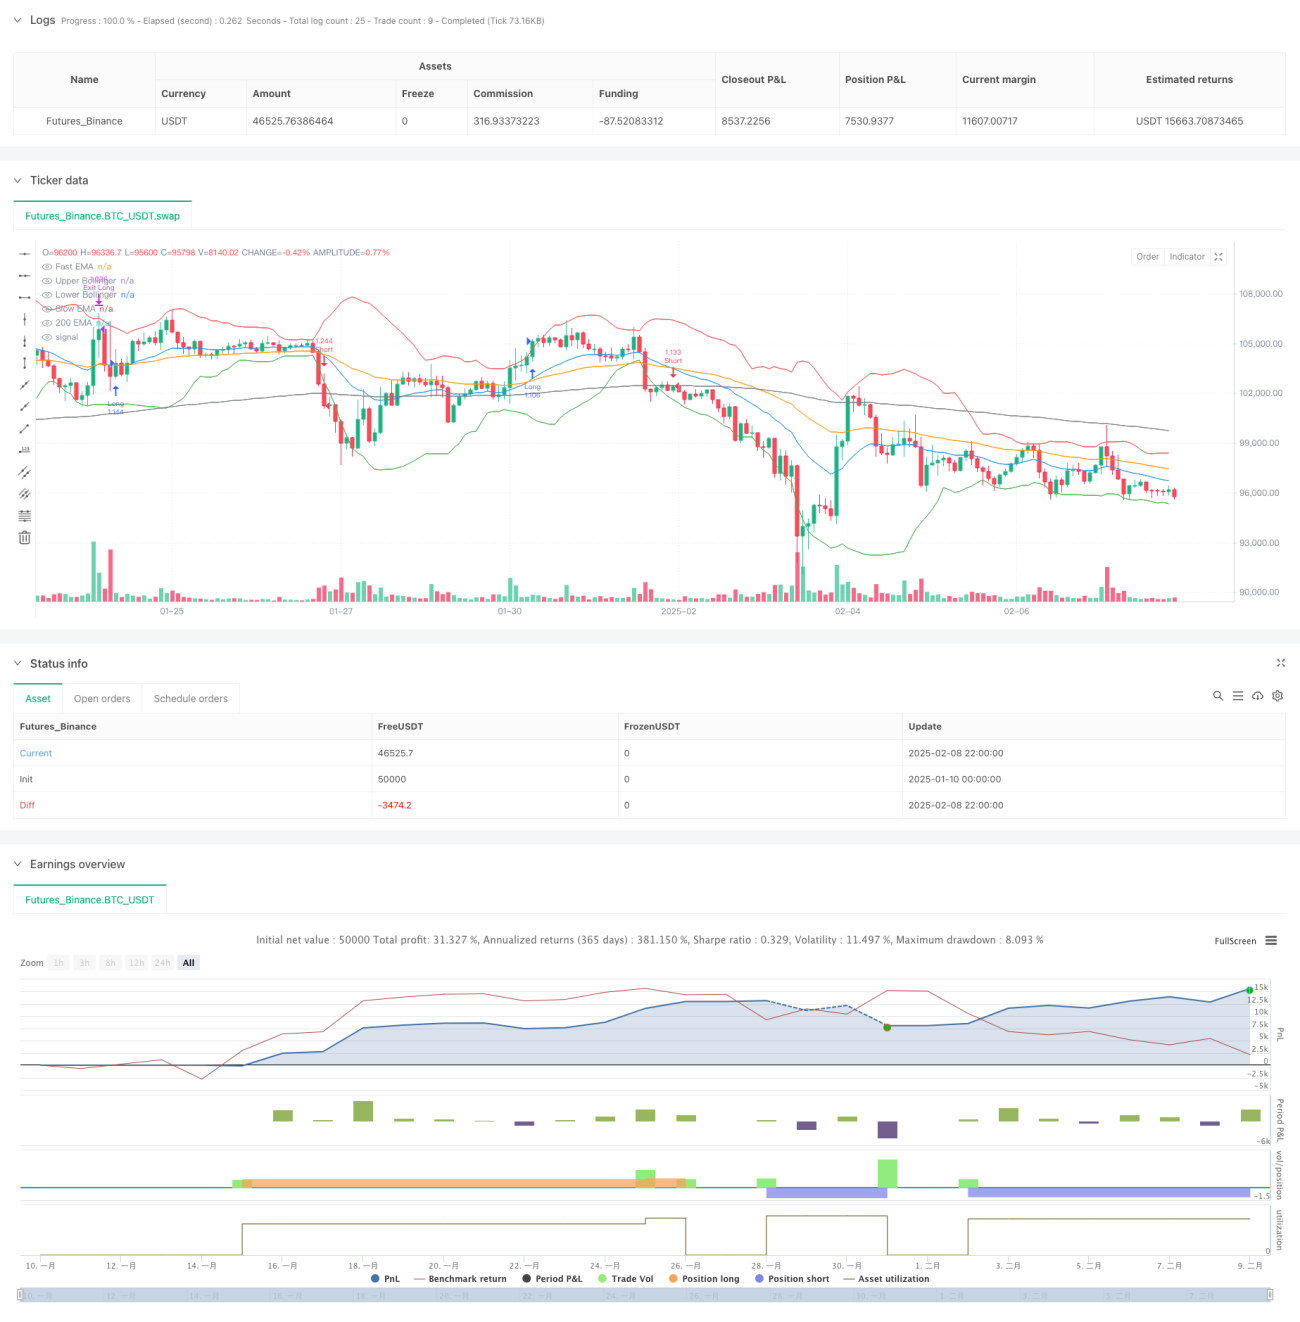
/*backtest
start: 2025-01-10 00:00:00
end: 2025-02-09 00:00:00
period: 2h
basePeriod: 2h
exchanges: [{"eid":"Futures_Binance","currency":"BTC_USDT"}]
*/

//@version=5
strategy("Altcoin Long/Short Strategy", overlay=true, initial_capital=1000, default_qty_type=strategy.percent_of_equity, default_qty_value=200, commission_type=strategy.commission.percent, commission_value=0.1)

// —————— Inputs ——————- 1