Stratégie de tendance dynamique - Système de synchronisation de bande dynamique multi-périodes en zigzag

Aperçu
Cette stratégie est un système de trading multidimensionnel qui combine l'indicateur ZigZag et l'indicateur William. Il permet d'identifier les hauts et les bas importants de la bande passante, tout en utilisant l'indicateur William pour confirmer les points d'entrée lorsque le marché atteint un état de surachat ou de survente. Cette combinaison permet non seulement de capturer les principaux points de retournement de tendance du marché, mais également d'améliorer la précision des transactions grâce à la confirmation de la dynamique.
Principe de stratégie
La logique centrale de la stratégie repose sur deux composantes principales:
- L'indicateur littéral identifie les hauts et les bas des bandes significatives en définissant la profondeur et les paramètres de déviation, filtre le bruit du marché et détermine la direction de la tendance. Lorsqu'un nouveau bas de la bande est formé, il indique le début d'une tendance à la hausse et un nouveau haut de la bande indique le début d'une tendance à la baisse.
- L'indicateur William calcule l'état de dynamique du marché en comparant le prix actuel avec le prix le plus élevé au cours d'une période donnée. Lorsque la valeur de l'indicateur dépasse 80, il indique une survente ((occasions potentielles d'acheter), et une rupture de 20 indique une survente ((occasions potentielles de vendre).
Les règles de négociation de la stratégie sont les suivantes:
- Plus de conditions: l'indicateur de mots identifie un nouveau bas de gamme et l'indicateur de William franchit la zone de survente
- Conditions de dépréciation: l'indicateur de mots identifie un nouveau sommet de la bande et l'indicateur de William se déplace vers le bas à partir de la zone de surachat
- Le stop loss est de 1% et le stop loss est de 2%.
Avantages stratégiques
- Confirmation multidimensionnelle: amélioration de la fiabilité des signaux de transaction par la double confirmation des tendances et des dynamiques
- Adaptabilité: les paramètres d'écart de l'indicateur de forme verbale peuvent être ajustés en fonction des fluctuations dynamiques du marché
- Contrôle des risques: une stratégie de stop-loss à pourcentage fixe pour contrôler le risque de chaque transaction
- Une bonne visualisation: affichage clair des signaux de trading grâce à des balises et des graphiques pour une analyse et une optimisation faciles
Risque stratégique
- Risque de choc: Faux signaux de rupture fréquents sur le marché horizontal
- Risque de glissement: des glissements plus importants sont possibles à grande vitesse
- Sensitivité des paramètres: le choix des paramètres de l'indicateur a un impact significatif sur la performance de la stratégie
- Lagueur de signal: il est possible de rater des événements rapides en raison de la nécessité de confirmer la formation de nouveaux points de bande
Orientation de l'optimisation de la stratégie
- Ajout de filtres d'environnement de marché: des indicateurs de volatilité peuvent être ajoutés pour identifier l'état du marché, en utilisant différents paramètres dans différents environnements
- Optimisation de stop-loss dynamique: la position de stop-loss peut être ajustée dynamiquement en fonction de l'ATR ou du taux de volatilité
- Introduction de la confirmation de transaction: ajout de la vérification de transaction lors de la génération du signal
- Filtrage temporel: vous pouvez ajouter un filtrage temporel pour éviter de négocier pendant les périodes les plus volatiles.
Résumer
Il s'agit d'un système de trading complet qui combine le suivi des tendances et le trading dynamique. Grâce à la synergie de plusieurs indicateurs techniques, il est possible de contrôler efficacement les risques tout en maintenant un taux de victoire élevé. Bien qu'il existe un certain retard, il est possible d'obtenir un effet de trading stable grâce à une optimisation raisonnable des paramètres et une gestion des risques.
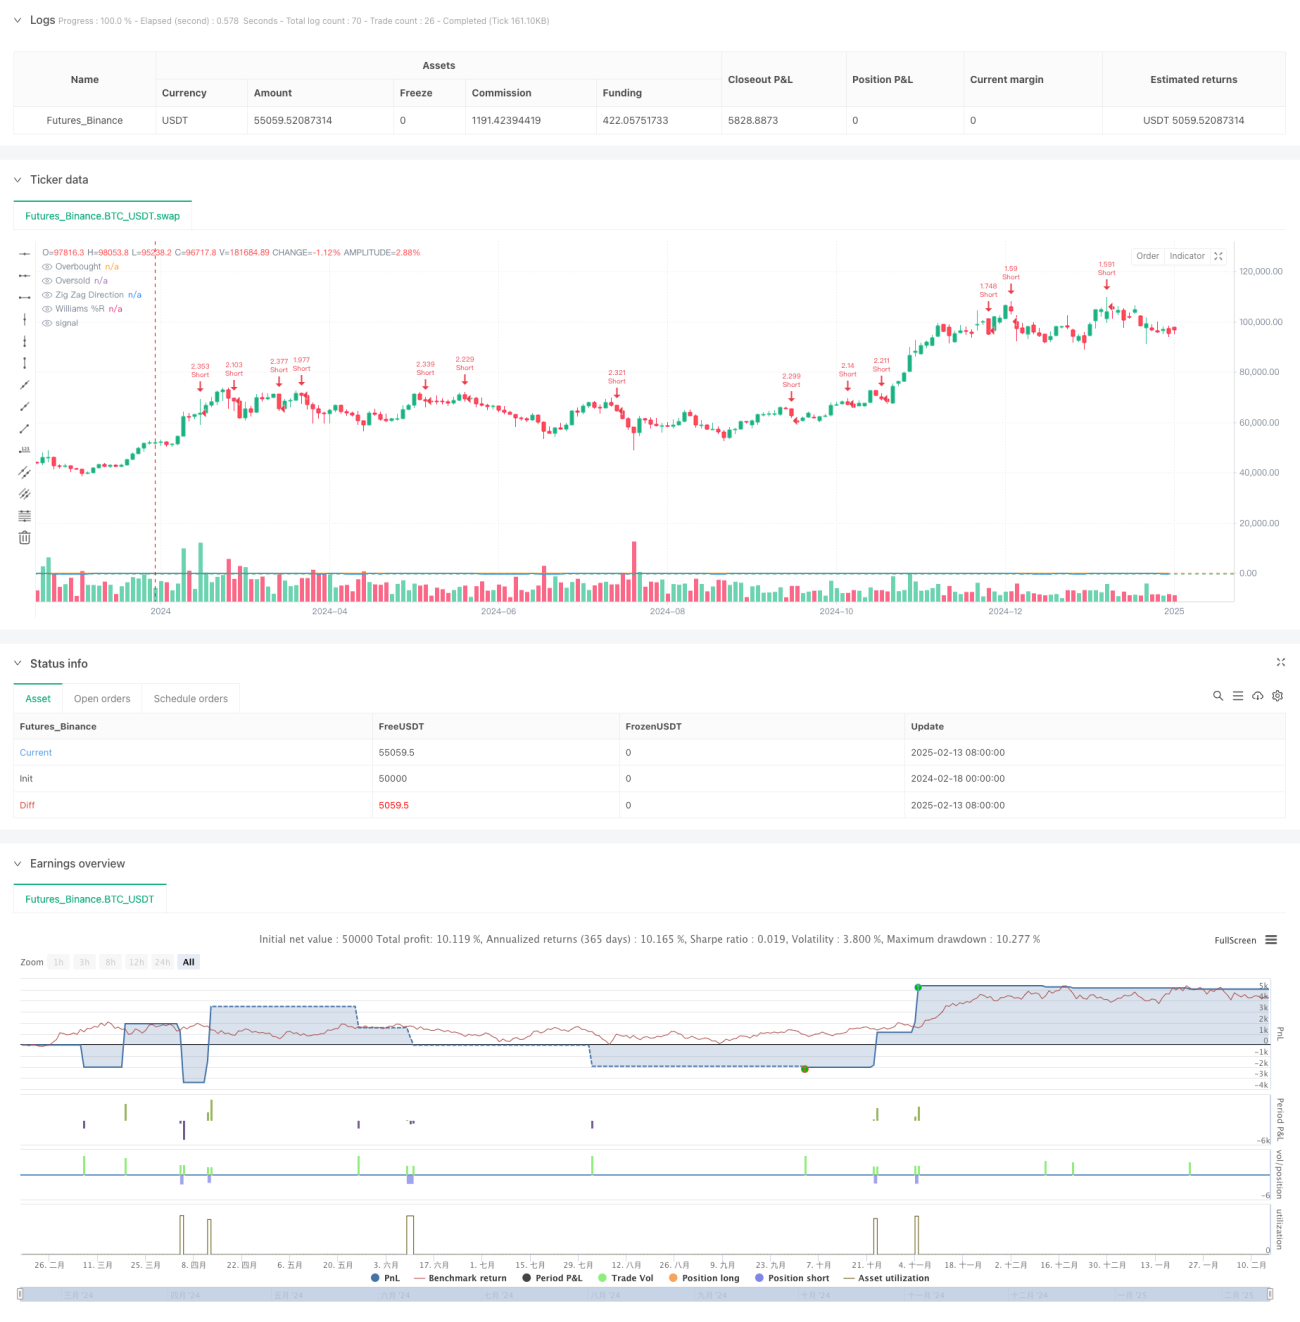
/*backtest
start: 2024-02-18 00:00:00
end: 2025-02-15 08:00:00
period: 2d
basePeriod: 2d
exchanges: [{"eid":"Futures_Binance","currency":"BTC_USDT"}]
*/

//@version=6
strategy("Zig Zag + Williams %R Strategy", overlay=true, default_qty_type=strategy.percent_of_equity, default_qty_value=300)

// ====================- 1