
Aperçu
La stratégie est un système de trading de suivi de tendance basé sur les ondes de Gauss et l'indicateur StochRSI. La stratégie identifie les tendances du marché via le canal de Gauss et, combinée à la zone de survente et de survente de l'indicateur StochRSI, optimise le moment d'entrée. Le système utilise une méthode de combinaison multivariée pour construire le canal de Gauss et suivre les tendances des prix en ajustant la dynamique de l'orbite ascendante et descendante.
Principe de stratégie
Au cœur de la stratégie se trouve un canal de prix construit à partir de l'algorithme de Gauss. La mise en œuvre comprend les étapes clés suivantes:
- La fonction polynomial f_filt9x est utilisée pour réaliser des ondes de Gauss à 9 degrés, afin d'améliorer l'effet de filtrage par l'optimisation des pôles
- Calcul de la ligne principale et du canal de fluctuation basé sur le prix HLC3
- Le mode Reduced Lag permet de réduire le temps de filtrage et le mode FastResponse permet d'améliorer la vitesse de réponse.
- Déterminer le signal de transaction en utilisant la fourchette de surachat et de survente du Stoch RSI (80/20)
- Les signaux de multiplication combinés avec l'indicateur StochRSI sont générés lorsque le canal de Gauss est à la hausse et que le prix se déplace
- La position est levée lorsque le prix est tombé en dessous de la barre.
Avantages stratégiques
- Les ondes de Gauss ont une excellente capacité de réduction du bruit, permettant de filtrer efficacement le bruit du marché
- Un suivi fluide de la tendance est possible grâce à une adéquation multivariée, ce qui réduit les faux signaux
- Prise en charge de l'optimisation des délais et des modes de réponse rapides, adaptés aux caractéristiques du marché
- La combinaison de l'indicateur StochRSI pour optimiser le moment d'entrée et améliorer le taux de réussite des transactions
- Utilisation de la largeur de canal dynamique pour s'adapter aux fluctuations du marché
Risque stratégique
- Il y a un certain retard dans les mouvements de Gauss, ce qui peut entraîner une entrée ou une sortie en retard.
- La fréquence des signaux de transaction peut augmenter les coûts de transaction dans un marché en crise.
- Le StochRSI peut générer des signaux de retard dans certaines conditions de marché
- Le processus d'optimisation des paramètres est complexe et nécessite de réajuster les paramètres selon les conditions du marché.
- Le système est plus exigeant sur les ressources de calcul, et le calcul en temps réel présente un certain retard.
Orientation de l'optimisation de la stratégie
- Introduction d'un mécanisme d'optimisation des paramètres adaptatifs, permettant d'ajuster les paramètres en fonction de la dynamique du marché
- Ajout d'un module de reconnaissance des environnements de marché, avec différentes combinaisons de paramètres dans différentes conditions de marché
- Optimisation de l'algorithme des ondes de Gauss pour réduire encore plus les délais de calcul
- L'introduction de plus d'indicateurs techniques pour la vérification croisée et améliorer la fiabilité du signal
- Développer des mécanismes intelligents d'arrêt des pertes et améliorer la capacité de contrôle des risques
Résumer
La stratégie permet un suivi efficace des tendances du marché grâce à la combinaison des ondes de Gauss et de l'indicateur StochRSI. Le système a une bonne capacité de réduction du bruit et de reconnaissance des tendances, mais il existe également un certain retard et une difficulté à optimiser les paramètres. Grâce à une optimisation et à une amélioration continues, la stratégie devrait générer des gains stables dans les transactions réelles.
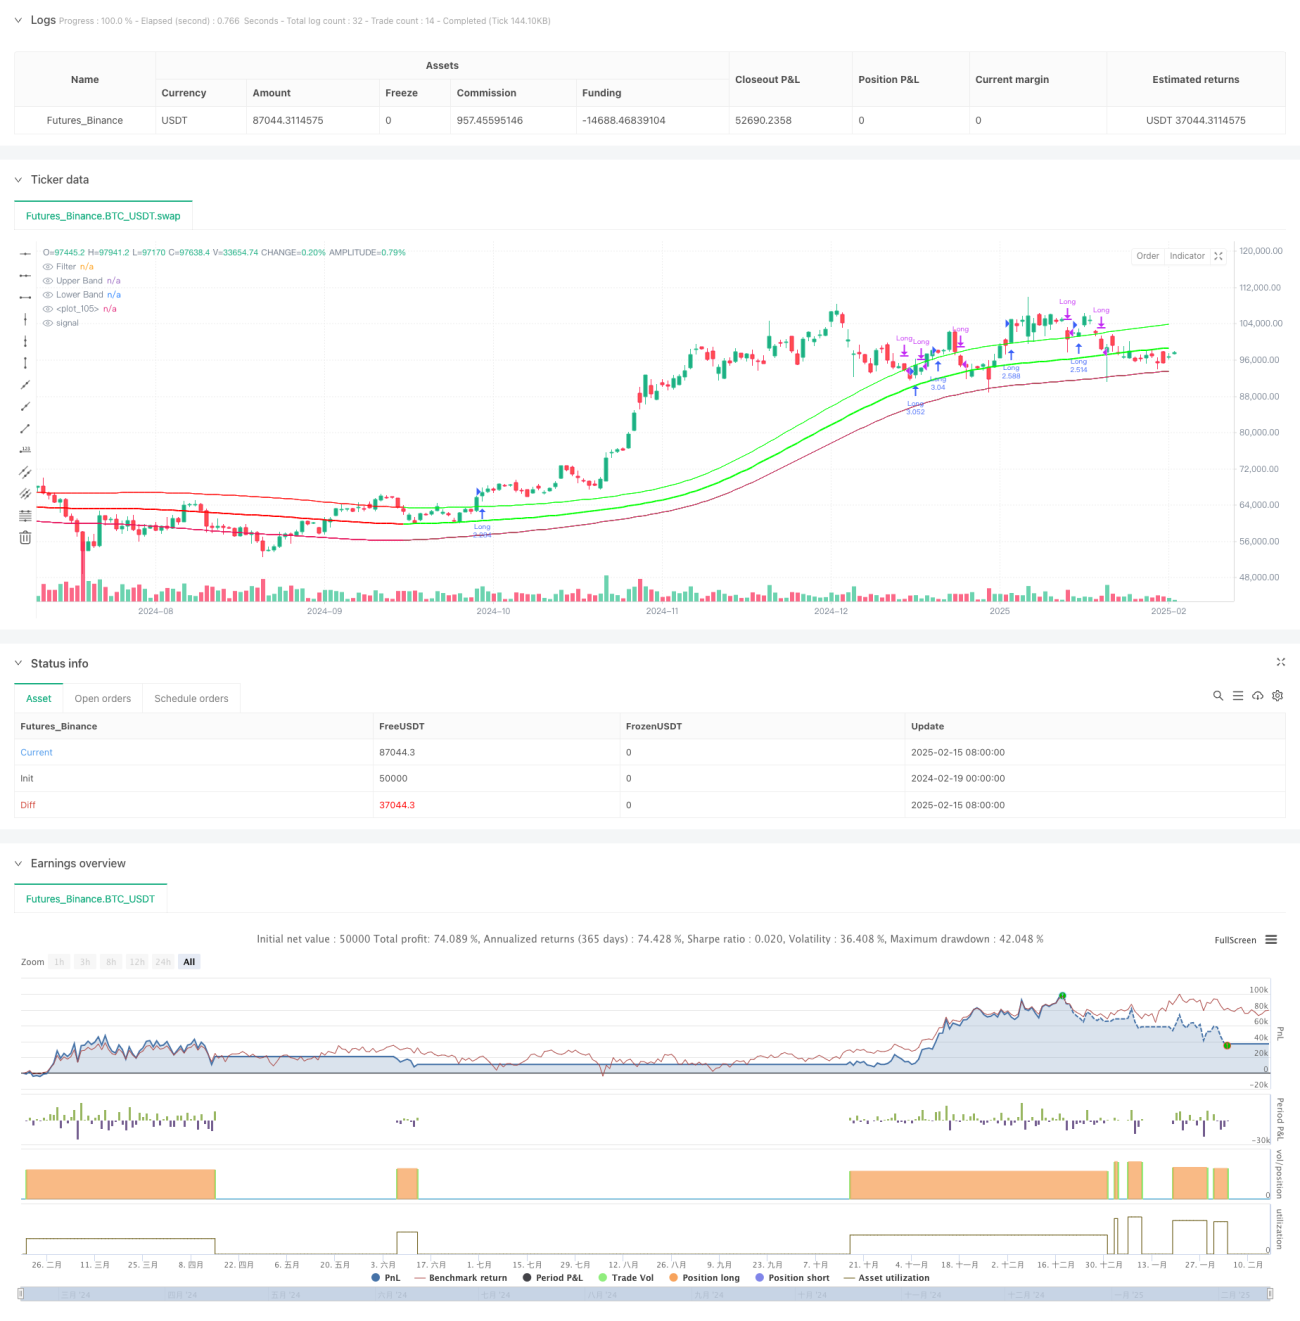
/*backtest
start: 2024-02-19 00:00:00
end: 2025-02-16 08:00:00
period: 1d
basePeriod: 1d
exchanges: [{"eid":"Futures_Binance","currency":"BTC_USDT"}]
*/

//@version=5
strategy(title="Demo GPT - Gaussian Channel Strategy v3.0", overlay=true, commission_type=strategy.commission.percent, commission_value=0.1, slippage=0, default_qty_type=strategy.percent_of_equity, default_qty_value=250)

// ============================================- 1