
Aperçu
Cette stratégie est un système de trading de suivi de tendance basé sur un Indice de Force Relative (RSI) amélioré. Elle calcule une version modifiée du RSI et utilise sa ligne de signal pour capturer les retournements de tendance dans différents cycles de marché. Non seulement la stratégie calcule la valeur de l'indicateur, mais elle affiche également visuellement les zones de surachat et de survente, aidant ainsi les traders à évaluer plus intuitivement l'état du marché.
Principe de la stratégie
Le principe central de la stratégie consiste à identifier les tendances du marché via le calcul du RSI amélioré (ARSI). Les étapes incluent :
- Calculer le plus haut et le plus bas sur une période donnée pour obtenir l'intervalle de prix.
- Calculer la différence basée sur la variation des prix.
- Lisser la différence à l'aide d'une méthode de moyenne mobile optionnelle (EMA, SMA, RMA, TMA).
- Normaliser le résultat dans une plage de 0 à 100.
- Générer un signal long lorsque l'ARSI traverse la ligne de signal en dessous de 50.
- Générer un signal court lorsque l'ARSI traverse la ligne de signal au-dessus de 50.
Avantages de la stratégie
- Mécanisme de confirmation de signal robuste – le croisement de l'ARSI avec la ligne de signal, combiné au filtrage par l'axe central (50), garantit la fiabilité des signaux.
- Adaptabilité – prend en charge plusieurs méthodes de moyenne mobile, permettant un ajustement selon les caractéristiques du marché.
- Gestion des risques raisonnable – utilise une gestion par pourcentage de la position pour contrôler efficacement le risque par transaction.
- Visualisation claire – affiche les zones de surachat/survente avec des remplissages de couleur pour une évaluation rapide.
- Gestion des positions inverses – en cas de signal opposé, la stratégie ferme automatiquement la position existante, évitant le risque de positions bidirectionnelles.
Risques de la stratégie
- Risque de marché en range – des signaux fréquents et faux peuvent se produire dans un marché latéral.
- Risque de retard – en raison de l'utilisation de moyennes mobiles, les signaux présentent un certain décalage.
- Sensibilité aux paramètres – différents réglages de paramètres peuvent entraîner des performances très variables.
- Risque d'adaptation au marché – la stratégie peut afficher des performances très différentes selon les environnements de marché.
- Risque de gestion du capital – une gestion de position à pourcentage fixe peut entraîner des risques importants lors de fluctuations violentes.
Axes d'optimisation
- Introduire un filtre de volatilité – ajouter l'indicateur ATR pour filtrer les signaux dans des environnements de faible volatilité.
- Ajouter un indicateur de confirmation de tendance – combiner des indicateurs de tendance à plus long terme pour améliorer la fiabilité des signaux.
- Optimiser la gestion des positions – ajuster dynamiquement la taille de la position en fonction de la volatilité du marché.
- Ajouter un mécanisme de stop-loss – mettre en place un stop-loss dynamique basé sur l'ATR pour mieux contrôler le risque.
- Développer des paramètres adaptatifs – étudier des méthodes d'optimisation dynamique des paramètres pour améliorer l'adaptabilité.
Conclusion
Il s'agit d'une stratégie de suivi de tendance à la structure complète et à la logique claire. Grâce à la méthode innovante de calcul du RSI amélioré, combinée aux avantages de plusieurs indicateurs techniques, elle constitue un système de trading fiable. Bien qu'elle comporte certains risques inhérents, avec une optimisation raisonnable et des mesures de gestion des risques, cette stratégie offre de bonnes perspectives d'application pratique. Il est recommandé aux traders de tester minutieusement les réglages des paramètres en conditions réelles et d'ajuster la configuration de la stratégie en fonction de l'environnement du marché.
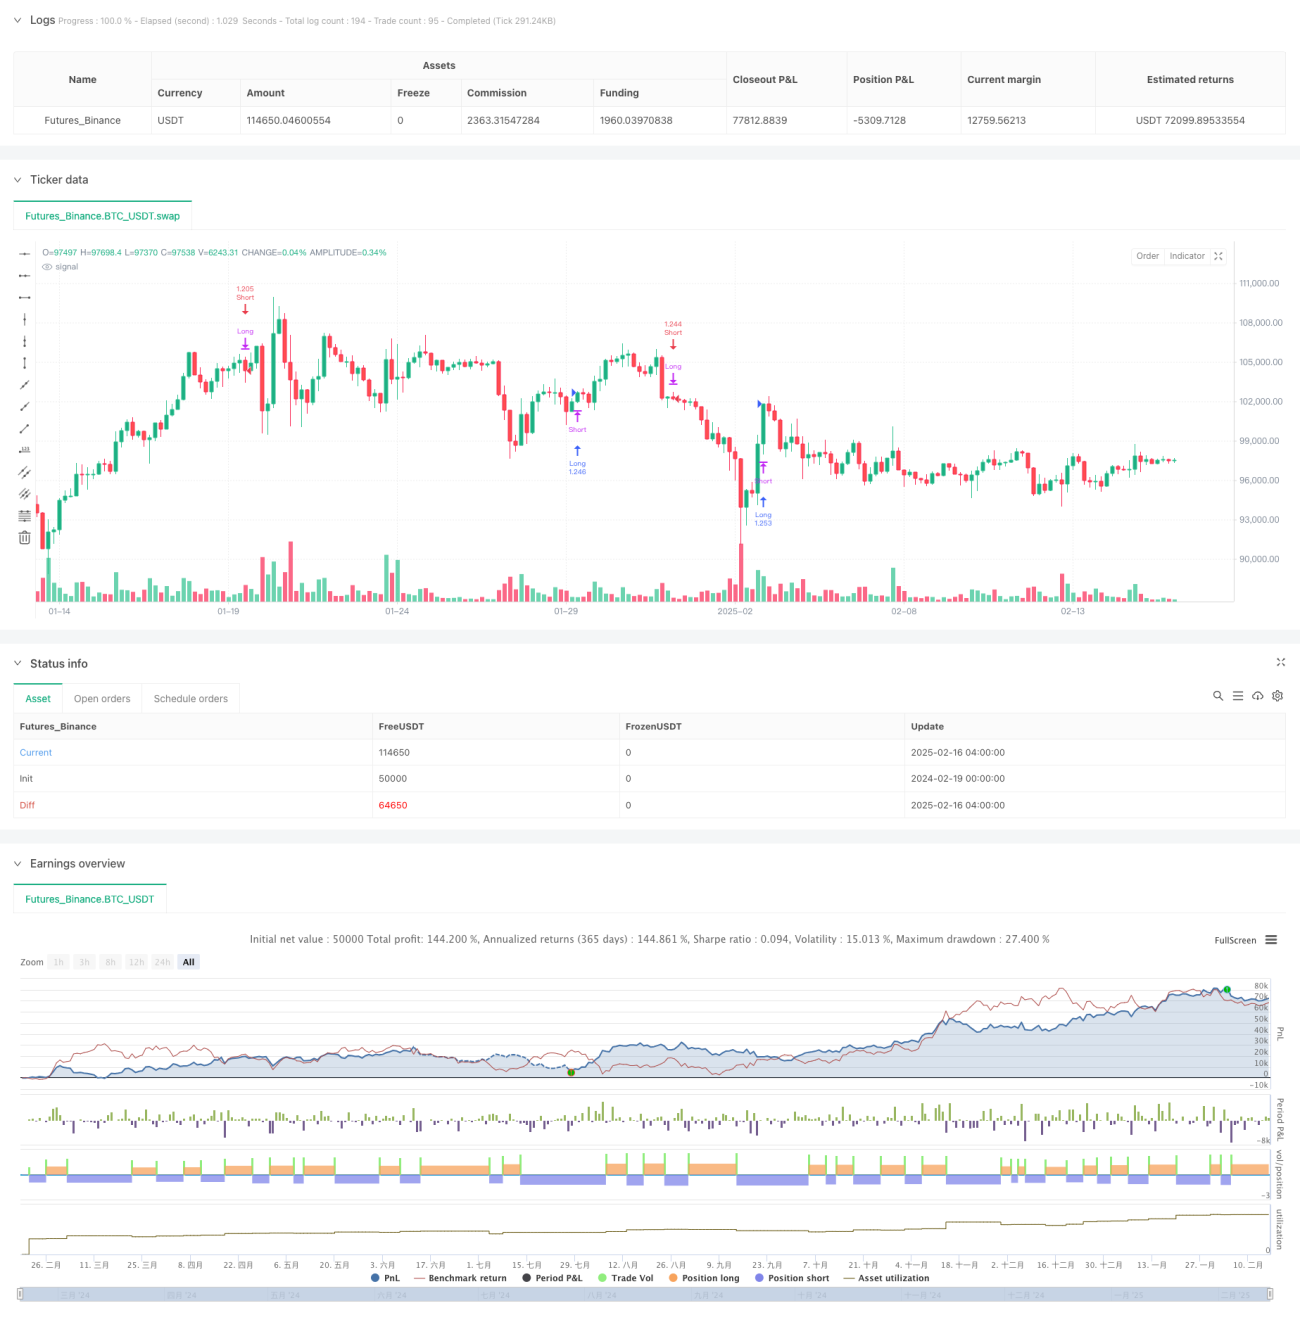
/*backtest
start: 2024-02-19 00:00:00
end: 2025-02-16 08:00:00
period: 4h
basePeriod: 4h
exchanges: [{"eid":"Futures_Binance","currency":"BTC_USDT"}]
*/

//@version=6
strategy("Ultimate RSI [LuxAlgo] Strategy", shorttitle="ULT RSI Strat", overlay=false, initial_capital=10000, currency=currency.USD, default_qty_type=strategy.percent_of_equity, default_qty_value=100)

//------------------------------------------------------------------------------- 1