
La stratégie est un système de trading quantitatif basé sur des canaux de régression linéaire et des diagrammes de Heinrich Himmler, combiné à un mécanisme de stop-loss dynamique, spécialement conçu pour saisir les opportunités de fluctuation rapide du marché.
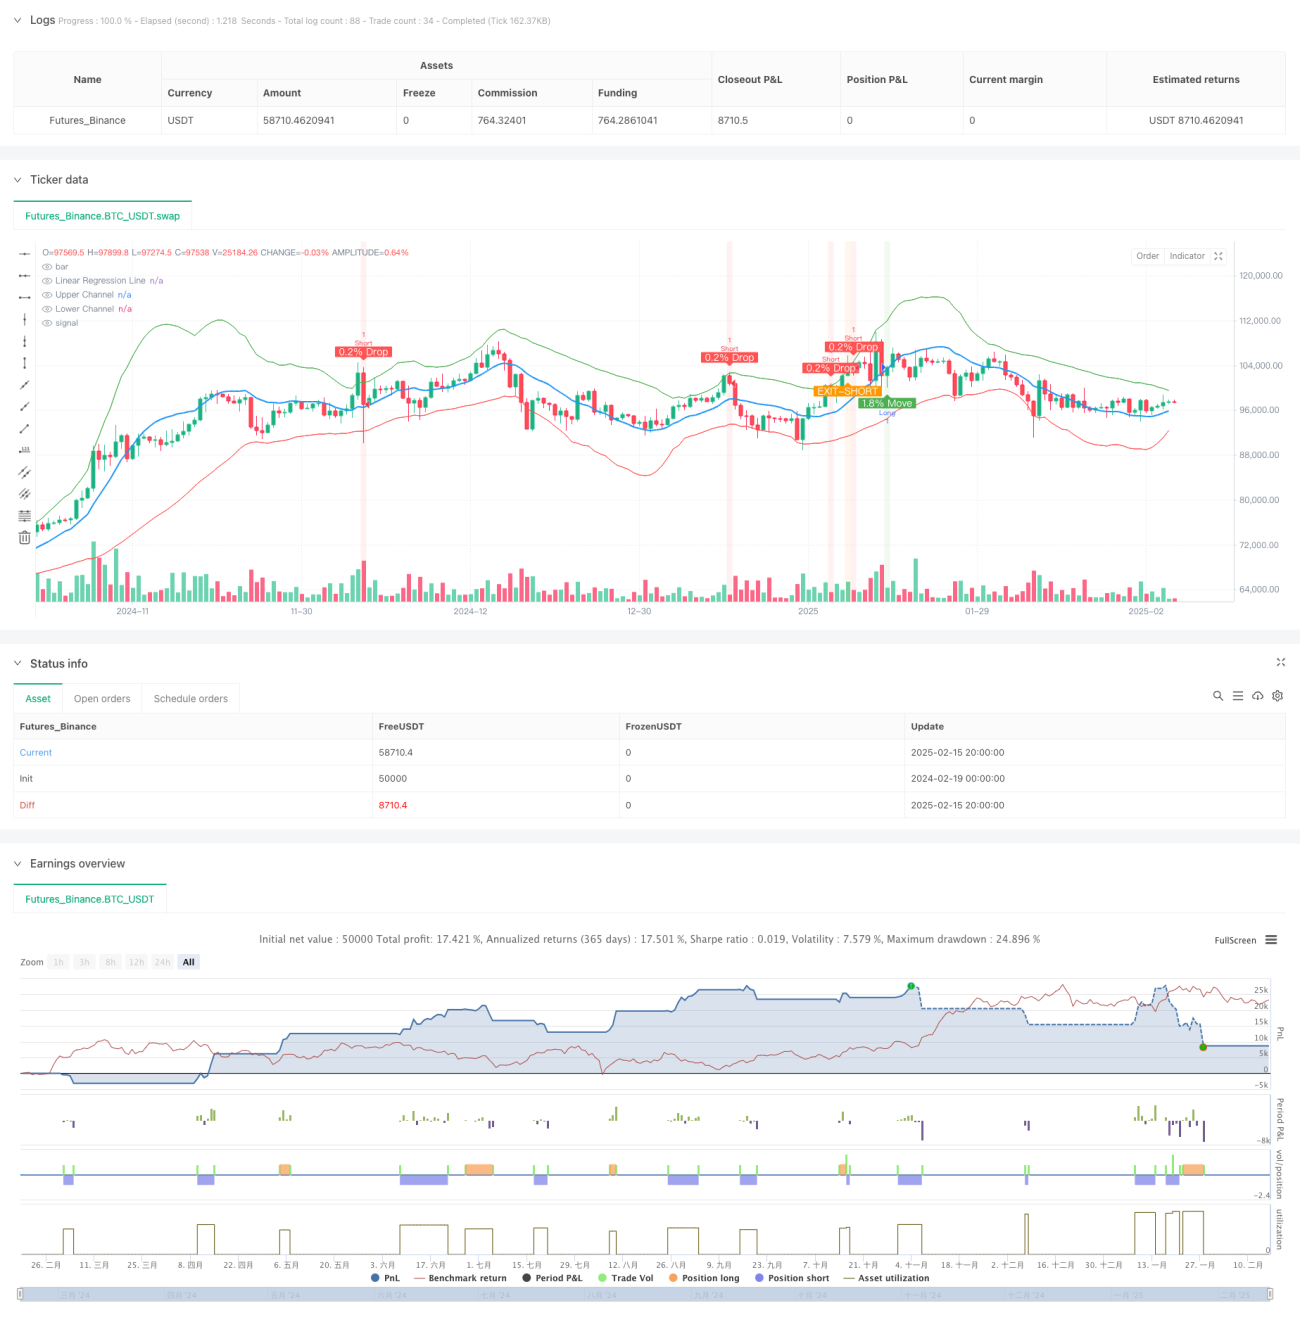
La stratégie utilise le canal de régression linéaire comme cadre principal de négociation pour identifier les opportunités de négociation potentielles en surveillant les mouvements des prix dans le canal. Le système émet plusieurs signaux lorsque les prix franchissent le tunnel et enregistrent une hausse de plus de 1,8%; le système émet un vide lorsque les prix franchissent le canal et enregistrent une baisse de plus de 0,2% . La stratégie de signaux intègre également un système de sortie dynamique basé sur le diagramme de Heinrich Himmler, ainsi qu’un mécanisme de gestion des risques de 10% d’arrêt et de 5% de perte.
Le cœur de la stratégie est basé sur un calcul de régression linéaire sur 30 cycles, en réglant la largeur du canal par 2 fois l’écart-type. Le signal d’entrée est basé sur les conditions suivantes:
Cette stratégie offre aux traders un système de trading relativement complet grâce à la combinaison d’une voie de régression linéaire et d’une rupture de prix. Son avantage réside dans la combinaison de plusieurs indicateurs techniques et de mesures de contrôle des risques, mais elle nécessite toujours l’optimisation et l’ajustement en fonction des conditions réelles du marché.
/*backtest
start: 2024-02-19 00:00:00
end: 2025-02-16 08:00:00
period: 12h
basePeriod: 12h
exchanges: [{"eid":"Futures_Binance","currency":"BTC_USDT"}]
*/
//@version=6
strategy('STRATEGY WITH SL', overlay=true)
// Parameters for Linear Regression
length = input.int(30, title='Linear Regression Length')
mult = input.float(2.0, title='Channel Multiplier', step=0.1)
// Calculate Linear Regression
regression_line = ta.linreg(close, length, 0)
// Calculate Standard Deviation
stddev = ta.stdev(close, length)
// Upper and Lower Channel Boundaries
upper_channel = regression_line + mult * stddev
lower_channel = regression_line - mult * stddev
// Plot the Linear Regression and Channel
plot(regression_line, color=color.blue, linewidth=2, title='Linear Regression Line')
plot(upper_channel, color=color.green, linewidth=1, title='Upper Channel')
plot(lower_channel, color=color.red, linewidth=1, title='Lower Channel')
// Parameters for Price Move Check (Indicator 1: 1.8% Move)
threshold_move = 1.8
large_threshold_move = 5.0
timeframe_for_large_move = 120
// Calculate the percentage change over the last 3 minutes
priceChange = (close - close[3]) / close[3] * 100
// Calculate the percentage change over the last 2 hours (120 minutes)
priceChange2Hour = (close - close[120]) / close[120] * 100
// Condition for a price move greater than 1.8%
isPriceUp = priceChange > threshold_move
// Condition for price move greater than 5% in 2 hours (no alert if true)
isLargePriceMove = priceChange2Hour > large_threshold_move
// Parameters for Price Drop Check (Indicator 2: 0.2% Drop)
threshold_drop = 0.2 / 100 // 0.2% threshold
// Get the price 3 minutes ago
price_3min_ago = request.security(syminfo.tickerid, '3', close[1])
// Calculate the percentage drop over the last 3 minutes
price_drop = (close - price_3min_ago) / price_3min_ago
// Condition for a 0.2% drop
drop_condition = price_drop <= -threshold_drop
// Track whether the price has crossed the upper or lower Linear Regression channel
var bool lower_crossed = false
var bool upper_crossed = false
var bool move_after_cross = false
var bool alert_sent = false
// Reset flags when price crosses channels
if (close < lower_channel)
lower_crossed := true
move_after_cross := false
if (close > upper_channel)
upper_crossed := true
alert_sent := false
// Combine both conditions for price crossing lower and upper channels and move/drop conditions
final_condition_long = lower_crossed and isPriceUp and not move_after_cross and not isLargePriceMove
final_condition_short = upper_crossed and drop_condition and not alert_sent
// Set flags when conditions are met
if (final_condition_long)
move_after_cross := true
if (final_condition_short)
alert_sent := true
// Heikin-Ashi calculation for dynamic timeframe (3-minute)
heikin_open = (open + close) / 2
heikin_close = (open + high + low + close) / 4
heikin_high = math.max(high, math.max(heikin_open, heikin_close))
heikin_low = math.min(low, math.min(heikin_open, heikin_close))
// Conditions for EXIT signals based on Heikin-Ashi candle body
exit_long_condition = (heikin_open > lower_channel and heikin_close < lower_channel) or (heikin_open < lower_channel and heikin_close > lower_channel)
exit_short_condition = heikin_open < upper_channel and heikin_close > upper_channel
// Strategy logic: Enter long or short based on the combined conditions
// Long Entry Condition
if (final_condition_long)
strategy.entry('Long', strategy.long)
// Short Entry Condition
if (final_condition_short)
strategy.entry('Short', strategy.short)
// Exit Conditions (EXIT-LONG and EXIT-SHORT)
if (exit_long_condition)
strategy.close('Long')
if (exit_short_condition)
strategy.close('Short')
// Take Profit and Stop Loss
take_profit = 10 / 100 // 10% Take Profit
stop_loss = 5 / 100 // 5% Stop Loss
// Calculate Take Profit and Stop Loss levels based on entry price
long_take_profit = strategy.position_avg_price * (1 + take_profit)
long_stop_loss = strategy.position_avg_price * (1 - stop_loss)
short_take_profit = strategy.position_avg_price * (1 - take_profit)
short_stop_loss = strategy.position_avg_price * (1 + stop_loss)
// Apply Take Profit and Stop Loss for Long and Short positions
strategy.exit('Take Profit/Stop Loss Long', from_entry='Long', limit=long_take_profit, stop=long_stop_loss)
strategy.exit('Take Profit/Stop Loss Short', from_entry='Short', limit=short_take_profit, stop=short_stop_loss)
// Plot background color when the conditions are met (for visual aid)
bgcolor(final_condition_long ? color.new(color.green, 90) : na, title='Price Move Alert After Lower Channel Crossed')
bgcolor(final_condition_short ? color.new(color.red, 90) : na, title='Price Drop Alert After Upper Channel Crossed')
bgcolor(exit_long_condition ? color.new(color.blue, 90) : na, title='EXIT-LONG Alert')
bgcolor(exit_short_condition ? color.new(color.orange, 90) : na, title='EXIT-SHORT Alert')
// Plot shapes when conditions are met
plotshape(final_condition_long, style=shape.labelup, location=location.belowbar, color=color.green, text='1.8% Move', textcolor=color.white, size=size.small)
plotshape(final_condition_short, style=shape.labeldown, location=location.abovebar, color=color.red, text='0.2% Drop', textcolor=color.white, size=size.small)
plotshape(exit_long_condition, style=shape.labeldown, location=location.abovebar, color=color.purple, text='EXIT-LONG', textcolor=color.white, size=size.small)
plotshape(exit_short_condition, style=shape.labelup, location=location.belowbar, color=color.orange, text='EXIT-SHORT', textcolor=color.white, size=size.small)
// Alert conditions for price moves and exits
alertcondition(final_condition_long, title="Price Move > 1.8% After Lower LR Channel Cross", message="Price crossed the lower Linear Regression Channel and moved more than 1.8% in the last 3 minutes!")
alertcondition(final_condition_short, title="Price Drop > 0.2% After Upper LR Channel Cross", message="Price crossed the upper Linear Regression Channel and dropped more than 0.2% in the last 3 minutes!")
alertcondition(exit_long_condition, title="EXIT-LONG: Heikin-Ashi Candle Body Crossing Lower LR Channel", message="The body of a 3-minute Heikin-Ashi candle is crossing outside the lower Linear Regression Channel.")
alertcondition(exit_short_condition, title="EXIT-SHORT: Heikin-Ashi Candle Body Crossing Upper LR Channel", message="The body of a 3-minute Heikin-Ashi candle is crossing outside the upper Linear Regression Channel.")