
Aperçu
La stratégie est un système de trading intégré basé sur plusieurs indicateurs techniques, combinant des indicateurs de dynamique, des indicateurs de tendance et des indicateurs de volatilité, pour capturer les opportunités de fluctuation à court terme du marché. La stratégie identifie les opportunités de trading grâce à des signaux de croisement MACD, une confirmation de tendance EMA, un filtrage des conditions de survente RSI et de la force de tendance ADX, et utilise un stop-loss dynamique basé sur l'ATR pour gérer le risque.
Principe de stratégie
La logique fondamentale de la stratégie repose sur les éléments clés suivants :
- L'indicateur MACD est utilisé pour capturer les variations de la dynamique et pour déterminer le moment d'entrée par le croisement des lignes rapides et lentes
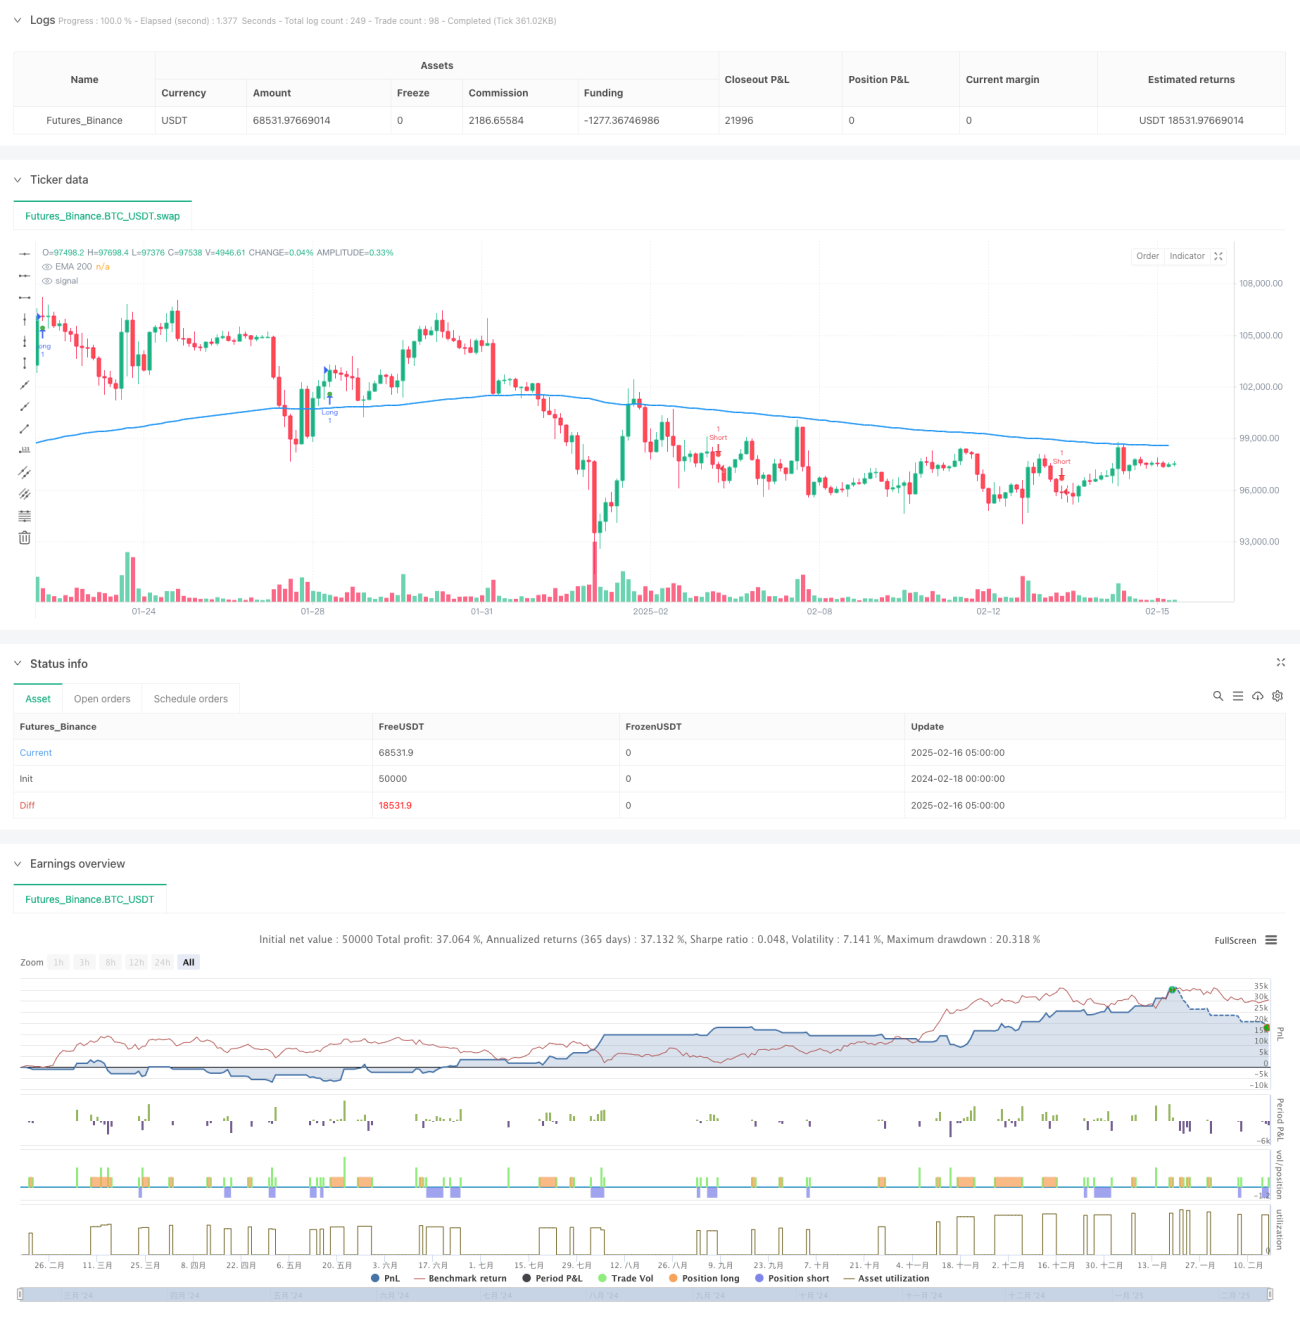
- L'EMA à 200 cycles est utilisée pour confirmer la direction de la tendance globale, les prix situés au-dessus de la moyenne sont considérés comme une tendance à plusieurs têtes, au contraire d'une tendance à la tête
- L'indicateur RSI est utilisé pour confirmer la dynamique des prix, RSI> 50 pour soutenir le plus, RSI < 50 pour soutenir le moins
- L'indicateur ADX est utilisé pour filtrer les tendances faibles, et l'entrée est considérée uniquement lorsque l'ADX est supérieur au seuil fixé
- L'indicateur ATR est utilisé pour calculer dynamiquement les positions de stop loss et de stop loss, en s'adaptant à la volatilité du marché.
Avantages stratégiques
- Vérification croisée de multiples indicateurs pour améliorer la fiabilité du signal
- Système de gestion dynamique des risques, qui ajuste automatiquement les arrêts de perte en fonction de la volatilité du marché
- Adaptabilité: les paramètres peuvent être ajustés en fonction des différentes conditions du marché
- Un mécanisme complet de confirmation des tendances pour réduire le risque de fausses percées
- Une logique d'entrée et de sortie systématique, réduisant le jugement subjectif
Risque stratégique
- Plusieurs indicateurs peuvent entraîner un décalage du signal
- Les cycles courts sont vulnérables au bruit du marché
- L'optimisation des paramètres peut conduire à un surapprentissage
- Les transactions à haute fréquence peuvent entraîner des coûts plus élevés
- Les stops fréquents peuvent être déclenchés en cas de fortes fluctuations du marché
Orientation de l'optimisation de la stratégie
- Présentation des indicateurs de volume comme confirmation auxiliaire
- Optimiser les seuils ADX pour améliorer l'efficacité du filtrage des tendances
- Augmenter le filtrage temporel pour éviter les périodes de faible liquidité
- Développer un système de paramètres adaptatifs pour améliorer la stabilité de la stratégie
- Ajout d'un filtre de volatilité du marché pour répondre aux différentes conditions du marché
Résumer
La stratégie utilise plusieurs indicateurs techniques pour construire un système de négociation complet. Bien qu'il y ait un certain retard et des défis d'optimisation des paramètres, la stratégie montre une meilleure adaptabilité et fiabilité grâce à une gestion des risques raisonnable et une optimisation continue. Il est recommandé aux traders de faire un retour d'expérience et une optimisation des paramètres suffisants avant leur utilisation sur le terrain.
- 1