
Aperçu
Il s'agit d'une stratégie de négociation de rupture basée sur l'action purement de prix, conçue avec un rapport de rendement à risque élevé de 1:5. La stratégie consiste à négocier en identifiant les ruptures des niveaux de prix clés et en associant la structure dynamique du marché à la définition d'objectifs de stop-loss et de profit. La stratégie ne repose sur aucun indicateur technique et prend des décisions de négociation entièrement basées sur l'action des prix en temps réel.
Principe de stratégie
La logique fondamentale de la stratégie comprend les éléments clés suivants :
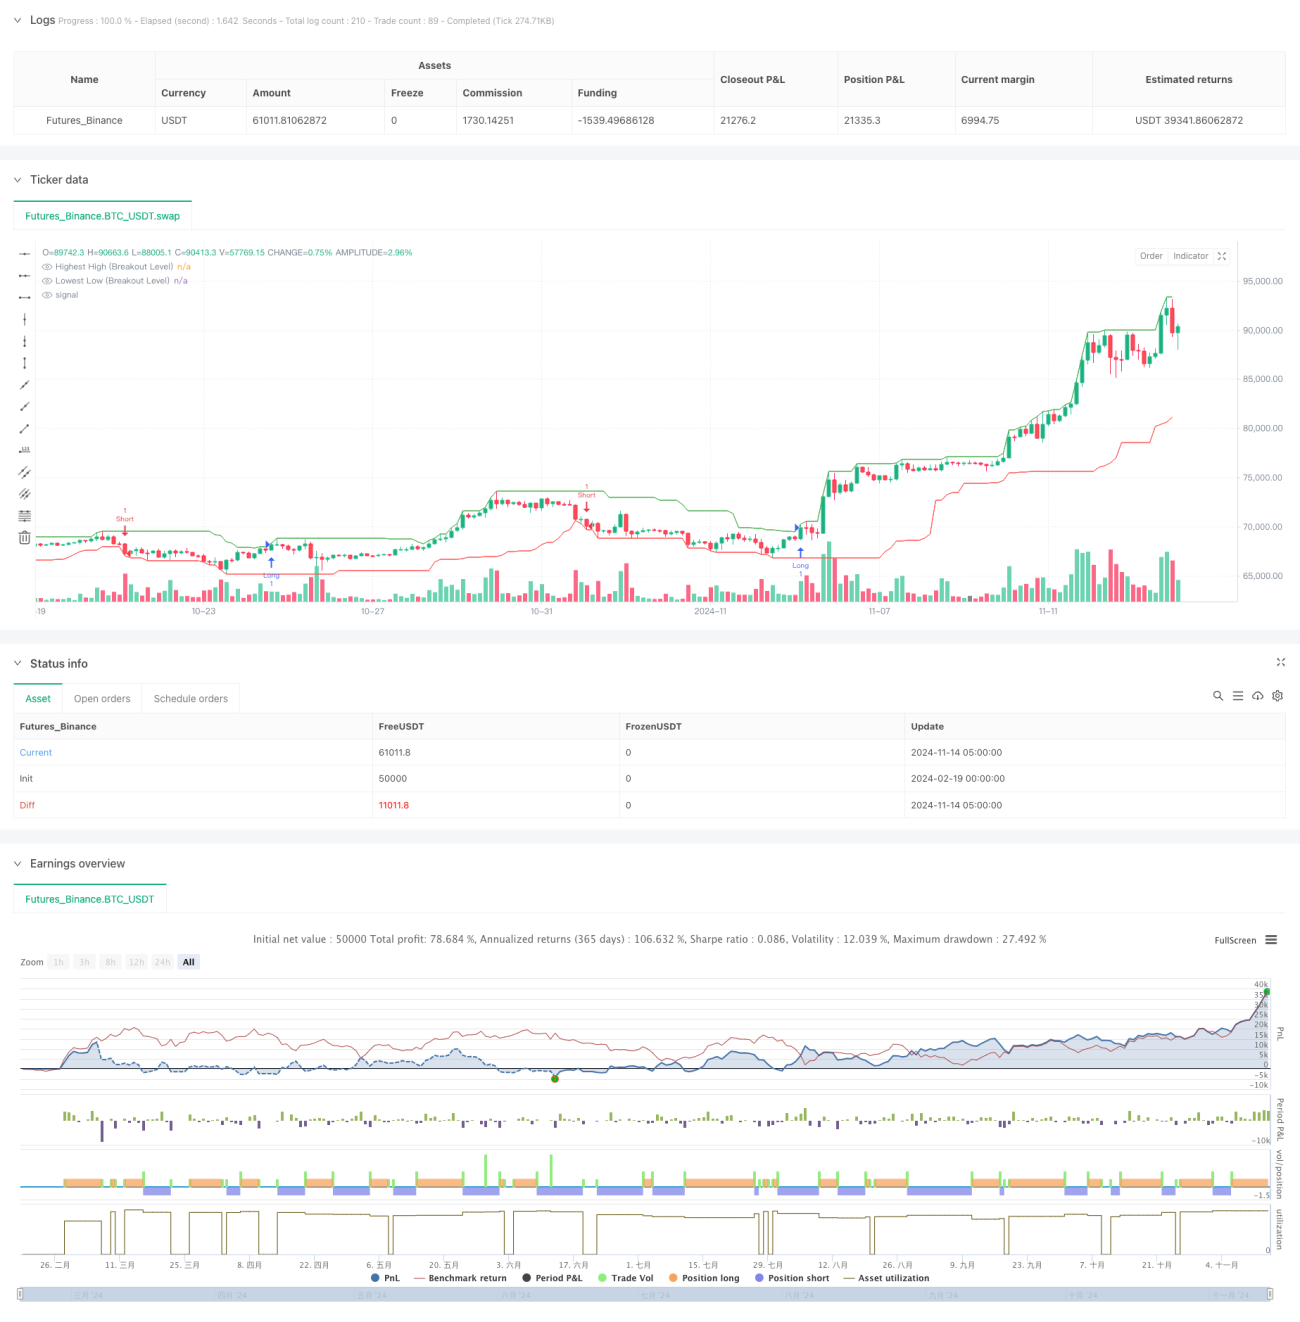
- Former des points de référence de rupture en identifiant les prix maximaux et minimaux à des périodes rétrospectives
- Ouverture d'une position en surplus lorsque le cours de clôture atteint un sommet antérieur, ouverture d'une position vide lorsqu'il atteint un sommet antérieur
- Basé sur la position d'arrêt dynamique pour les fluctuations récentes, les positions multiples sont arrêtées au plus bas et les positions vides au plus haut
- Position des objectifs de profit calculée sur la base d'un rapport de risque/rendement de 1:5
- Limiter le nombre maximum de transactions par jour afin d'éviter une survente
Le processus de négociation est entièrement basé sur le comportement des prix, sans utiliser d'indicateurs techniques comme référence.
Avantages stratégiques
- Le comportement pur des prix des transactions pour éviter les perturbations causées par le retard des indicateurs
- Le ratio de rendement par risque est élevé et le gain potentiel par transaction est cinq fois plus élevé que le risque.
- paramètres de stop-loss dynamiques, adaptés à la structure du marché
- Signaux de transaction clairs et marquages visuels pour faciliter l'exécution des transactions
- Les paramètres sont hautement ajustables pour s'adapter à différents environnements de marché
- Contrôle des risques rigoureux, y compris une limite de transactions par jour
Risque stratégique
- Les faux signaux de rupture peuvent être fréquents dans les marchés en crise.
- Le rapport de risque/rendement élevé peut conduire à des gains relativement faibles
- Un rappel après une percée peut déclencher un arrêt de perte
- Les changements de volatilité du marché peuvent affecter la performance de la stratégie
- Il faut des mouvements de prix plus importants pour atteindre les objectifs de profit
Mesures d’atténuation :
- Utilisation de la stratégie dans les marchés tendances
- Évitez les transactions pendant les grandes annonces
- La taille de position raisonnable
- Paramètres de vérification et d'optimisation périodiques
Orientation de l'optimisation de la stratégie
- Ajout d'un filtre de tendance pour négocier uniquement dans la direction de la tendance dominante
- Ajout d'un mécanisme de confirmation de la livraison pour améliorer la fiabilité de la percée
- Le ratio de retour sur risque ajusté en fonction de la dynamique de la volatilité
- L'introduction d'analyses à cycles multiples améliore la précision des transactions
- Développer des mécanismes de stop-loss plus intelligents, tels que le suivi des stop-loss
- Ajout de fonctionnalités de reconnaissance de l'environnement du marché et adaptation des paramètres de stratégie
Résumer
Il s'agit d'une stratégie de négociation de comportement de prix rigoureusement conçue, logiquement claire. Conçue avec un rapport de rendement à risque élevé, la recherche de gains substantiels tout en contrôlant efficacement les risques. L'avantage de la stratégie réside dans la conduite pure des prix, la flexibilité des paramètres et la perfection du contrôle des risques. Bien qu'il existe un certain risque de fausse percée, la stabilité et la fiabilité de la stratégie peuvent être encore améliorées par l'orientation optimisée recommandée.
- 1