
Aperçu
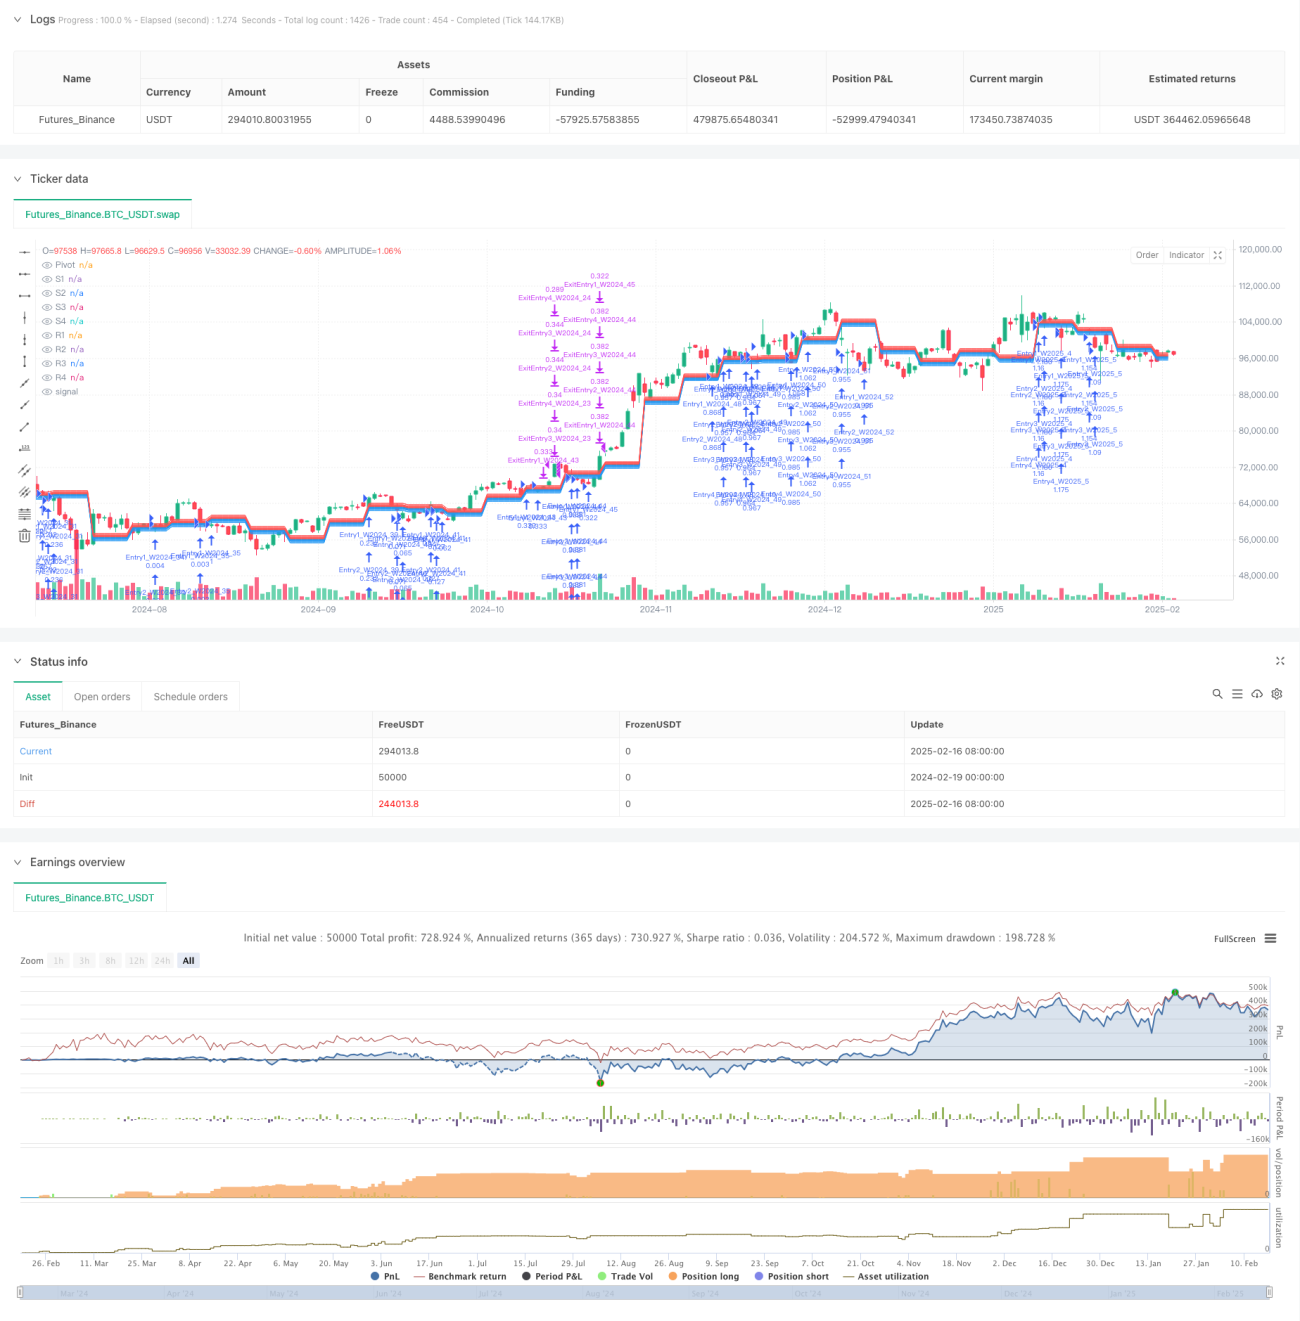
Cette stratégie est un système de trading de retour à la moyenne basé sur le Pivot Point. Elle détermine les points d'entrée et de sortie des transactions en calculant les niveaux de support (S1-S4) et de résistance (R1-R4) chaque semaine. La stratégie utilise une méthode de création de position par étapes, en effectuant plusieurs achats à différents niveaux de support et en tirant profit des niveaux de résistance correspondants.
Principe de stratégie
Le cœur de la stratégie est de calculer les pivots de la semaine en utilisant les hauts, les bas et les prix de clôture de la semaine précédente, puis de déterminer plusieurs niveaux de support et de résistance en fonction de la distance de points prédéfinie. Les achats sont effectués lorsque les prix touchent les niveaux de support et fixent un objectif de profit pour les niveaux de résistance correspondants.
Le pivot = (le prix le plus élevé de la semaine dernière + le prix le plus bas de la semaine dernière + le prix de clôture de la semaine dernière) / 3
La stratégie permet de détenir jusqu'à 4 positions simultanément, chacune correspondant à un support et une résistance différents. Toutes les positions recalculent les nouveaux niveaux de négociation au début de chaque semaine. Cette conception garantit la continuité des transactions et s'adapte aux changements du marché.
Avantages stratégiques
- La logique de transaction est claire, facile à comprendre et à exécuter
- La mise en place d'un portefeuille par tranches réduit le risque d'une seule transaction
- Utilisation de points de résistance de support au niveau de la circonférence pour réduire l'impact du bruit pendant la journée
- La stratégie peut adapter les paramètres de manière flexible en fonction des caractéristiques du marché
- Contrôle des risques par le pourcentage de portefeuille
- Il n'y a pas de délai pour imposer des limites de plafonnement et donner aux transactions une marge de profit suffisante.
Risque stratégique
- Aucun arrêt de perte, ce qui pourrait entraîner une reprise plus importante sur un marché en forte tendance
- Les positions multiples peuvent prendre plus de fonds
- Des signaux erronés peuvent apparaître sur des marchés très volatils
- Un mauvais réglage des supports peut entraîner une mauvaise position pour la construction d'un entrepôt.
Pour réduire le risque, il est recommandé d'ajouter un filtre de tendance, en ouvrant la position uniquement dans une tendance haussière; un stop-loss dynamique basé sur l'ATR peut également être configuré.
Orientation de l'optimisation de la stratégie
- Augmentation des mécanismes de confirmation des volumes et de la fiabilité des signaux d'entrée
- Introduction d'indicateurs techniques tels que le RSI pour le filtrage des surachats et des survente
- Développer des mécanismes de confirmation à cycles multiples pour réduire les faux signaux
- Optimiser le système de gestion des positions et ajuster le nombre de positions créées en fonction des fluctuations du marché
- Augmentation de l'analyse de la corrélativité pour éviter la création de positions simultanées dans des marchés hautement corrélatifs
Résumer
Il s'agit d'une stratégie de retour à la moyenne basée sur la théorie classique de l'analyse technique, qui capture les opportunités de négociation par un rebond de rupture dans les points de résistance soutenus par la courbe circulaire. La stratégie est conçue de manière simple et flexible, adaptée à une utilisation dans des marchés à forte volatilité.
- 1