
Aperçu
Il s'agit d'une stratégie de négociation à plusieurs périodes de temps basée sur la théorie des intervalles de cartographie. La stratégie identifie les opportunités de négociation potentielles en analysant principalement les formes de cartographie et les intervalles de prix des périodes de temps plus élevées. La stratégie intègre un filtre de volume de transaction et un mécanisme d'arrêt dynamique pour capturer les opportunités de tendance en franchissant les hauts et les bas de la période précédente.
Principe de stratégie
Le cœur de la stratégie est de surveiller les cas de rupture de la fourchette précédente sur une période de temps plus longue (de 4 heures par défaut).
- La stratégie continue de suivre et de stocker les hauts et les bas des deux premières lignes K de haute période
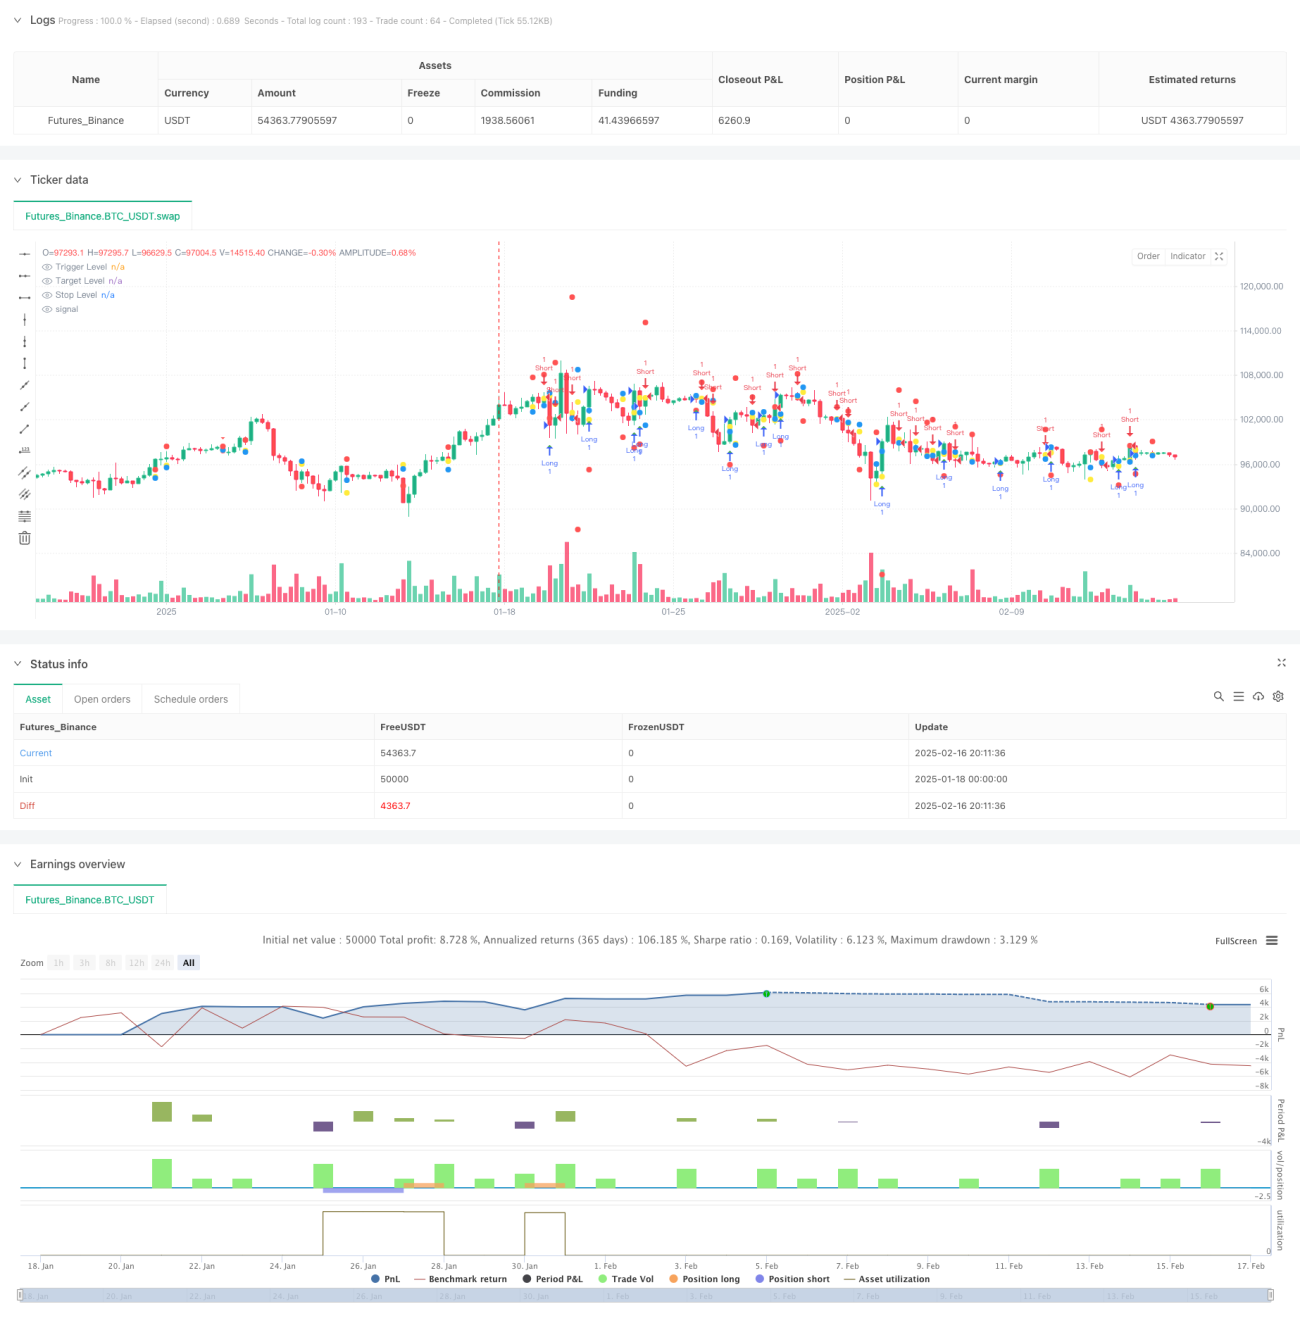
- Un signal de couverture est formé lorsque le prix de clôture d'une ligne K actuelle est inférieur au prix de clôture précédent et que la ligne K actuelle est à un niveau élevé.
- Un signal de multiplication est formé lorsque le prix d'achèvement d'une ligne K actuelle est supérieur au prix d'achèvement d'une ligne K précédente et que l'innovation de la ligne K actuelle est faible.
- Le prix d'entrée est fixé à la position haute ou basse qui déclenche la ligne K.
- Objectif de profit fixé à la hauteur ou à la basse correspondante de la période précédente
- Distance d'arrêt ajustée dynamiquement en fonction de la taille de l'intervalle
Avantages stratégiques
- L'analyse des périodes multiples fournit des signaux plus fiables
- Paramètres de stop-loss dynamiques qui s'adaptent aux fluctuations du marché
- Un mécanisme de filtrage de volume de transaction en option pour augmenter la confirmation des transactions
- Une interface visuelle claire, comprenant des marqueurs pour le prix de déclenchement, le prix de cible et le prix de stop
- La logique de la stratégie est simple, claire, facile à comprendre et à mettre en œuvre.
- Adapté à une variété de types de transactions et de conditions de marché
Risque stratégique
- Les faux signaux de rupture peuvent être fréquents dans les marchés en période de turbulence
- Un grand multiple de stop-loss peut entraîner des pertes excessives à la fois.
- La confiance dans les données historiques sur les prix peut être retardée dans un environnement de marché en évolution rapide
- L'impact des facteurs fondamentaux n'est pas pris en compte
- La mise en œuvre efficace peut être difficile dans des marchés moins liquides
Orientation de l'optimisation de la stratégie
- Introduction de filtres de tendance tels que les moyennes mobiles ou l'indicateur ADX
- Ajouter plus de critères de jugement de marché
- Optimiser la stratégie de stop loss et envisager l'introduction de stop loss mobile
- Ajouter un module de gestion de volume
- Considérez d'ajouter plus d'analyses de co-opération à des périodes de temps
- Introduction d'indicateurs de volatilité pour optimiser le jugement des intervalles
Résumer
Il s'agit d'une stratégie de négociation à plusieurs périodes de temps structurée et logiquement claire. La recherche d'opportunités potentielles de tendance est effectuée en analysant le comportement des prix à des périodes de temps plus élevées, tout en intégrant une gestion des risques et un mécanisme de filtrage. Le principal avantage de la stratégie réside dans son adaptabilité et son extensibilité, qui permet de s'adapter à différents environnements de marché par un simple ajustement des paramètres.
- 1