Aperçu
Il s’agit d’une stratégie de négociation basée sur une analyse des hauts et des bas d’une période d’un an. Cette stratégie permet d’identifier les signaux de négociation potentiels en calculant une moyenne mobile de la différence entre les hauts et les bas historiques.
Principe de stratégie
La logique fondamentale de la stratégie repose sur les étapes clés suivantes :
- Calcul Delta: Calcul de la différence de volume d’achat et de vente en analysant le mouvement des prix. Lorsque le prix de clôture est supérieur au prix d’ouverture, il est enregistré en tant que volume d’achat, et vice versa en tant que volume de vente.
- Traitement de la moyenne mobile: Traitement de la moyenne mobile à 14 cycles des valeurs delta pour réduire le bruit.
- Déterminer les hauts et les bas d’une année: calculer les hauts et les bas de la Delta SMA de l’année précédente.
- Conditions de déclenchement:
- Signal d’achat: déclenché lorsque le Delta SMA atteint 0 après un an de 70% de baisse
- Signal de vente: déclenchement lorsque le Delta SMA atteint 90% de son plus haut niveau de l’année, puis 60% de son plus bas niveau
Avantages stratégiques
- Capacité à saisir les tendances à long terme: grâce à l’analyse des données historiques sur une période d’un an, il est possible de saisir efficacement les principales tendances.
- Le filtrage du bruit est efficace: avec le traitement de la SMA et les conditions de trempage multiples, il réduit efficacement les faux signaux.
- Le contrôle des risques est raisonnable: les conditions d’entrée et de sortie sont clairement définies et les transactions excessives sont évitées.
- Adaptabilité: les paramètres de la stratégie peuvent être ajustés en fonction des différentes conditions du marché.
Risque stratégique
- Risque de latence: il est possible que le signal soit retardé en raison de l’utilisation d’une SMA et d’une longue période de rétroaction.
- Le risque de fausse percée: un faux signal peut être généré dans un marché instable.
- Dépendance aux conditions du marché: les performances peuvent être faibles dans des marchés où la tendance n’est pas évidente.
- Sensitivité des paramètres: les paramètres de seuil ont un impact significatif sur les performances de la stratégie.
Orientation de l’optimisation de la stratégie
- Ajustement de la marge dynamique: la marge des hauts et des bas peut être ajustée en fonction de la dynamique de la volatilité du marché
- Augmentation des indicateurs auxiliaires: amélioration de la fiabilité du signal en combinaison avec d’autres indicateurs techniques.
- Introduction d’un mécanisme d’arrêt des pertes: définir un arrêt dynamique pour contrôler le risque.
- Le filtrage du contexte de marché: ajouter la logique de jugement du contexte de marché et exécuter la stratégie dans l’environnement approprié.
Résumer
Il s’agit d’une stratégie de suivi des tendances à moyen et long terme basée sur l’analyse du volume des transactions, qui permet de capturer les tendances du marché en analysant les hauts et les bas historiques de la différence de valeur des ventes et des achats. La stratégie est conçue de manière rationnelle, les risques sont maîtrisés, mais il convient de prêter attention à l’adaptation à l’environnement du marché et à l’optimisation des paramètres.
/*backtest
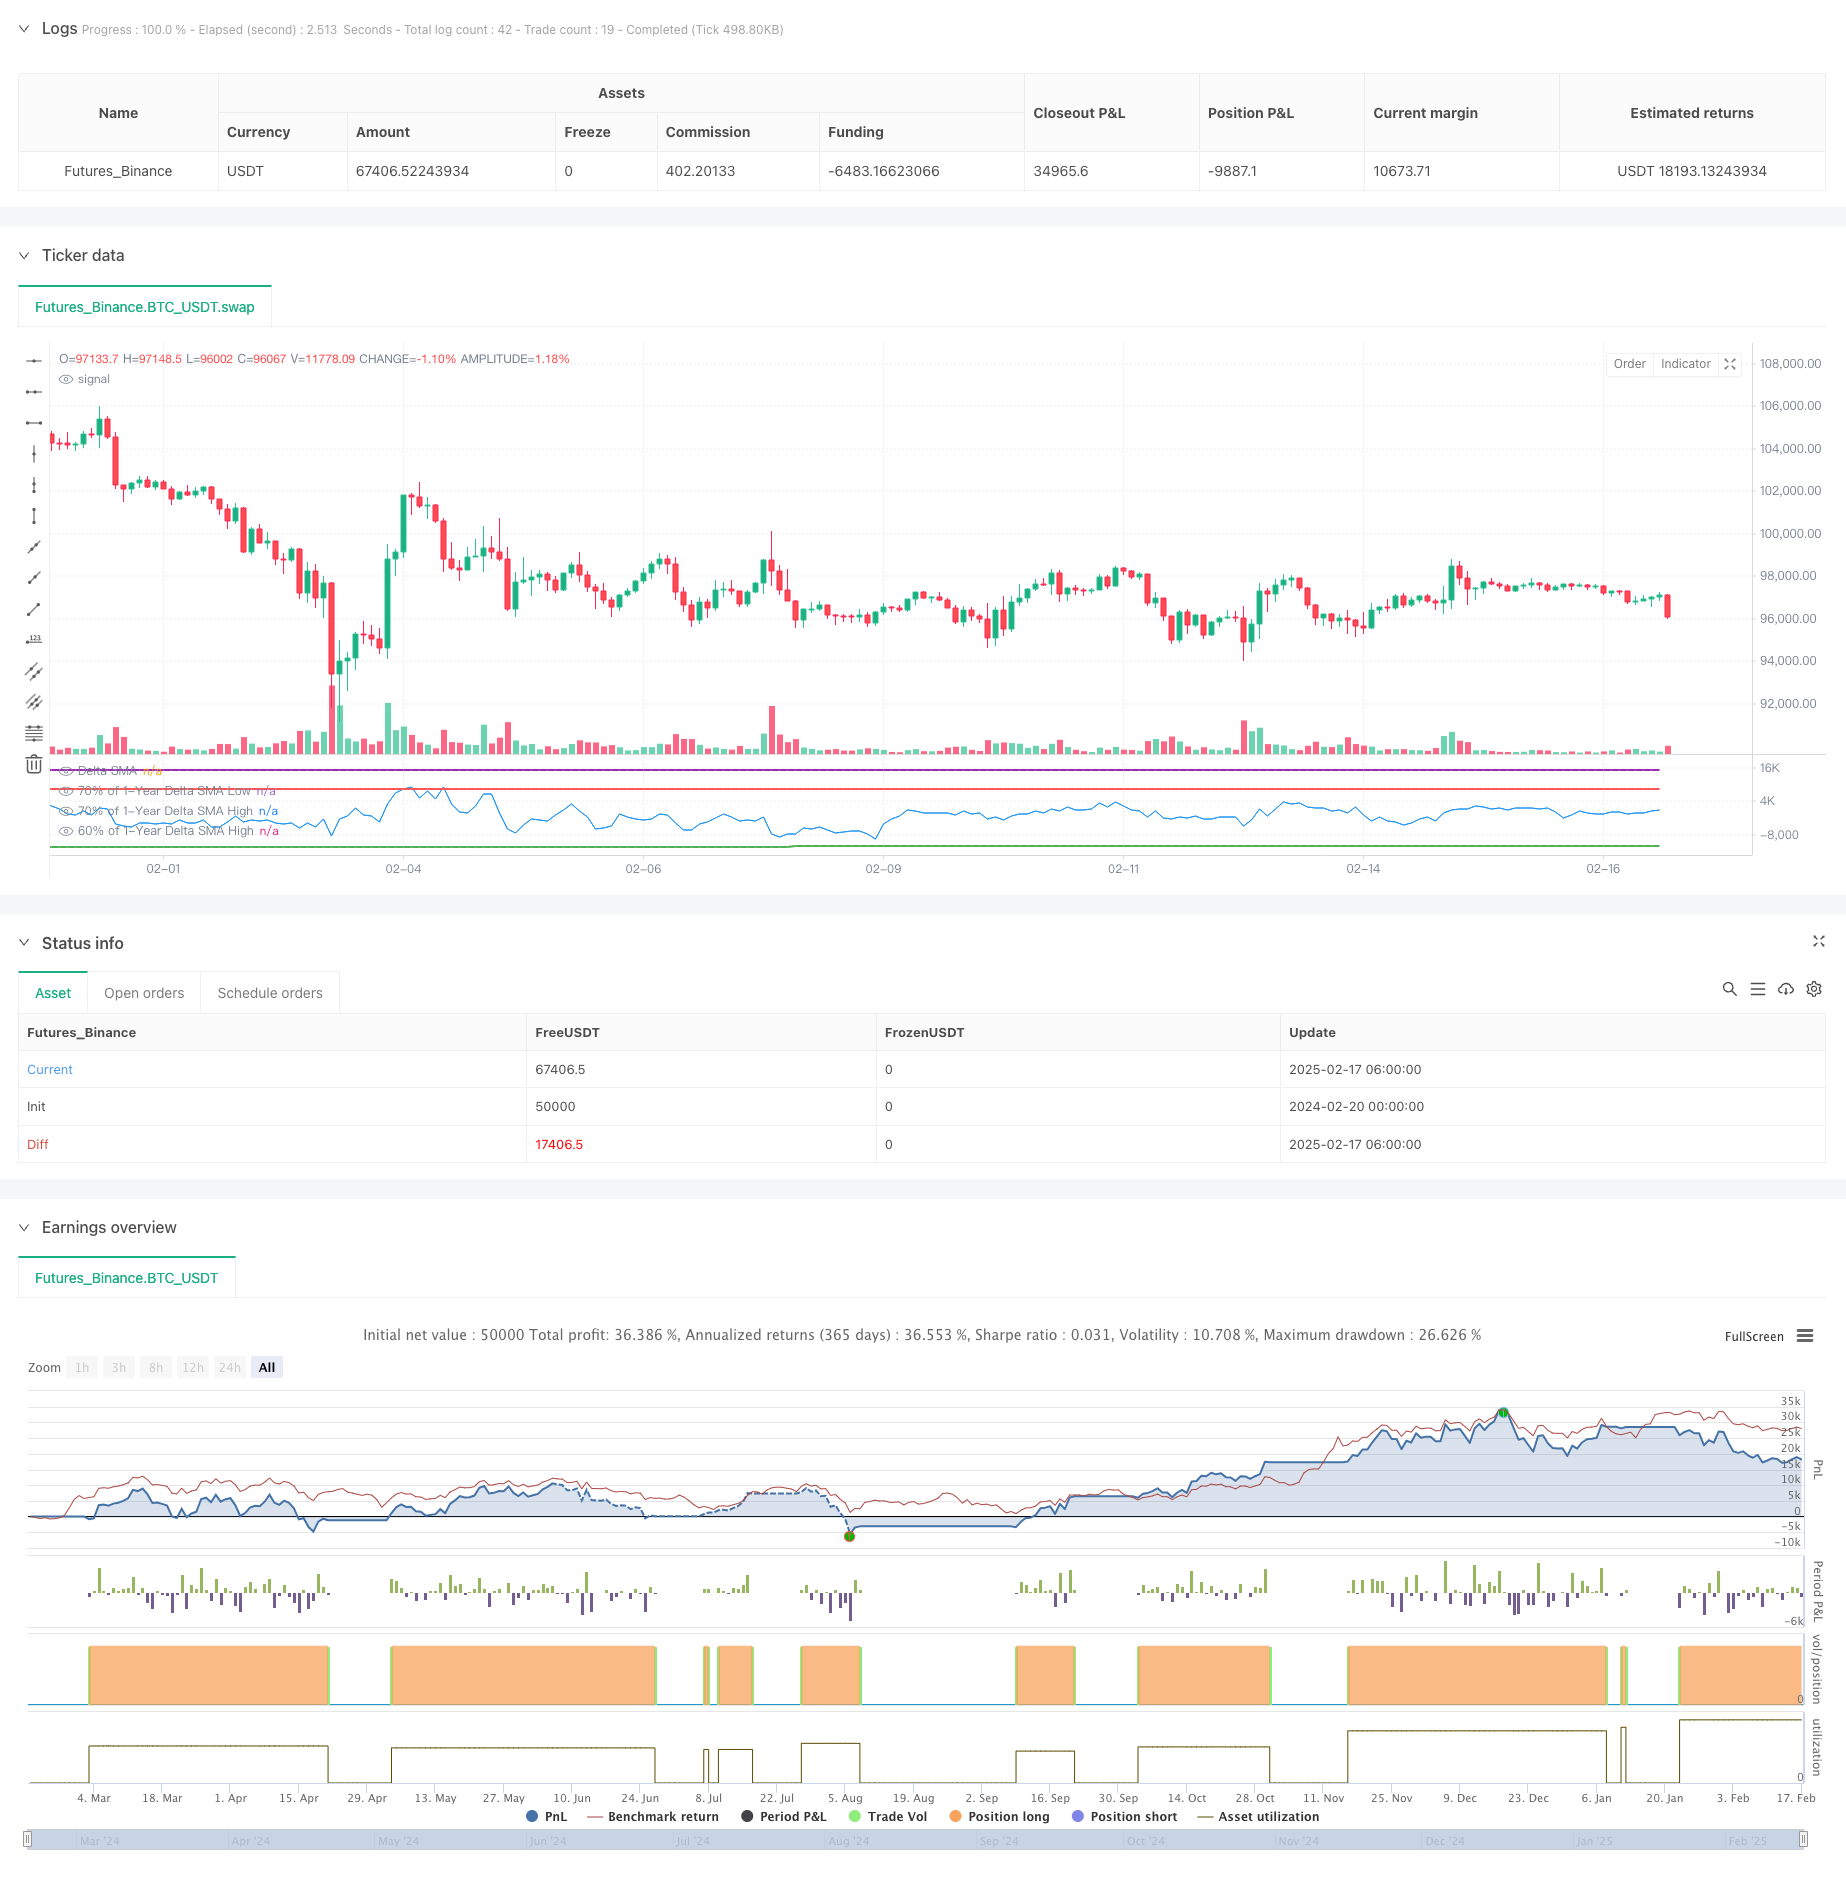
start: 2024-02-20 00:00:00
end: 2025-02-17 08:00:00
period: 2h
basePeriod: 2h
exchanges: [{"eid":"Futures_Binance","currency":"BTC_USDT"}]
*/
//@version=5
strategy("Delta SMA 1-Year High/Low Strategy", overlay = false, margin_long = 100, margin_short = 100)
// Inputs
delta_sma_length = input.int(14, title="Delta SMA Length", minval=1) // SMA length for Delta
lookback_days = 365 // Lookback period fixed to 1 year
// Function to calculate buy and sell volume
buy_volume = close > open ? volume : na
sell_volume = close < open ? volume : na
// Calculate the Delta
delta = nz(buy_volume, 0) - nz(sell_volume, 0)
// Calculate Delta SMA
delta_sma = ta.sma(delta, delta_sma_length)
// Lookback period in bars (1 bar = 1 day)
desired_lookback_bars = lookback_days
// Ensure lookback doesn't exceed available historical data
max_lookback_bars = math.min(desired_lookback_bars, 365) // Cap at 365 bars (1 year)
// Calculate Delta SMA low and high within the valid lookback period
delta_sma_low_1yr = ta.lowest(delta_sma, max_lookback_bars)
delta_sma_high_1yr = ta.highest(delta_sma, max_lookback_bars)
// Define thresholds for buy and sell conditions
very_low_threshold = delta_sma_low_1yr * 0.7
above_70_threshold = delta_sma_high_1yr * 0.9
below_60_threshold = delta_sma_high_1yr * 0.5
// Track if `delta_sma` was very low and persist the state
var bool was_very_low = false
if delta_sma < very_low_threshold
was_very_low := true
if ta.crossover(delta_sma, 10000)
was_very_low := false // Reset after crossing 0
// Track if `delta_sma` crossed above 70% of the high
var bool crossed_above_70 = false
if ta.crossover(delta_sma, above_70_threshold)
crossed_above_70 := true
if delta_sma < below_60_threshold*0.5 and crossed_above_70
crossed_above_70 := false // Reset after triggering sell
// Buy condition: `delta_sma` was very low and now crosses 0
buy_condition = was_very_low and ta.crossover(delta_sma, 0)
// Sell condition: `delta_sma` crossed above 70% of the high and now drops below 60%
sell_condition = crossed_above_70 and delta_sma < below_60_threshold
// Place a long order when buy condition is met
if buy_condition
strategy.entry("Buy", strategy.long)
// Place a short order when sell condition is met
if sell_condition
strategy.close("Buy")
// Plot Delta SMA and thresholds for visualization
plot(delta_sma, color=color.blue, title="Delta SMA")
plot(very_low_threshold, color=color.green, title="70% of 1-Year Delta SMA Low", linewidth=2)
plot(above_70_threshold, color=color.purple, title="70% of 1-Year Delta SMA High", linewidth=2)
plot(below_60_threshold, color=color.red, title="60% of 1-Year Delta SMA High", linewidth=2)
// Optional: Plot Buy and Sell signals on the chart
//plotshape(series=buy_condition, title="Buy Signal", location=location.belowbar, color=color.new(color.green, 0), style=shape.labelup, text="BUY")
//plotshape(series=sell_condition, title="Sell Signal", location=location.abovebar, color=color.new(color.red, 0), style=shape.labeldown, text="SELL")