
Aperçu
La stratégie est un système de trading de suivi de tendance basé sur les formes de rupture de la ceinture de Brin et de la ligne de coupe. La stratégie détermine le signal de négociation en identifiant trois lignes de coupe de rupture de la ceinture de Brin consécutives et en combinant la position du prix de clôture dans l'entité de la ligne de coupe. Le système utilise un ratio de risque/bénéfice fixe de 1:1 pour gérer les arrêts et les pertes de chaque transaction.
Principe de stratégie
La logique fondamentale de la stratégie repose sur les éléments clés suivants :
- La bande de Brin à 20 cycles est utilisée comme indicateur principal, avec un facteur de différence standard de 2,0
- Conditions d'entrée multiples: trois lignes K consécutives de clôture du prix de clôture se sont brisées, et ces trois lignes K sont des lignes du soleil, le prix de clôture est situé dans la moitié supérieure de l'entité
- Conditions d'entrée à vide: trois lignes K consécutives de clôture de prix ont déraillé, et ces trois lignes K sont des lignes négatives, les prix de clôture sont situés dans la moitié inférieure de l'entité
- Le stop loss est réglé à la valeur maximale de la première ligne de signal K.
- Résultat de risque sur la base du rapport 1:1 pour la position de stop
Avantages stratégiques
- Le mécanisme de confirmation multiple réduit efficacement le risque de fausse percée en imposant des exigences de forme pour trois percées consécutives de la ligne K
- Le jugement de la position des cours de clôture dans les entités de la ligne K renforce la fiabilité de la confirmation de la tendance
- Gestion des positions à l'aide d'un ratio risque/bénéfice fixe pour faciliter le contrôle des risques
- La logique de la stratégie est claire, facile à comprendre et à mettre en œuvre
- Affichage visuel des signaux de transaction grâce à la fonctionnalité de marquage pour faciliter l'analyse des retours
Risque stratégique
- Des faux signaux peuvent fréquemment se produire sur des marchés volatils
- Le rapport risque/bénéfice fixe peut ne pas être en mesure de saisir pleinement les tendances fortes
- Les exigences strictes de trois lignes K consécutives pourraient nous faire passer à côté de bonnes opportunités potentielles
- Le stop loss est réglé à la limite de la ligne K du signal, ce qui peut être trop éloigné en cas de forte oscillation.
Il est recommandé de gérer les risques de la manière suivante:
- Paramètres de la bande de Bryn ajustés en fonction des fluctuations cycliques du marché
- Résultats de l'analyse de l'évolution des caractéristiques du marché
- Ajouter des indicateurs de confirmation de tendance
- Optimiser la méthode de réglage de la position de stop loss
Orientation de l'optimisation de la stratégie
- Optimisation des paramètres:
- Les périodes de la ceinture de Bryn et le multiple de la différence standard peuvent être ajustés en fonction de la dynamique des différentes caractéristiques du marché
- Considérant la transformation des exigences des trois lignes K en jugements dynamiques
- Optimisation du signal :
- Augmentation des indicateurs de confirmation de tendance tels que l'ADX ou la ligne de tendance
- Mise en place d'un mécanisme de confirmation des livraisons
- Considérer l'ajout d'un indicateur de fluctuation comme aide
- Optimisation de la gestion des positions:
- Résultats de l'analyse de l'impact sur le rendement
- Ajout d'un module de gestion de fonds
- Le mécanisme de construction par lots et de stockage
- Optimisation du stop-loss:
- Mise en place d'un mécanisme de suivi des pertes
- Distance de rupture basée sur ATR
- Prendre en compte le temps perdu
Résumer
Il s'agit d'une stratégie de suivi de tendance structurée et logiquement claire. Le risque de faux signaux est réduit grâce à un mécanisme de confirmation multiple de la rupture de la ceinture de Brin et de la forme de la ligne de visée. La configuration fixe du rapport risque-bénéfice simplifie la gestion des transactions, mais limite également la flexibilité de la stratégie.
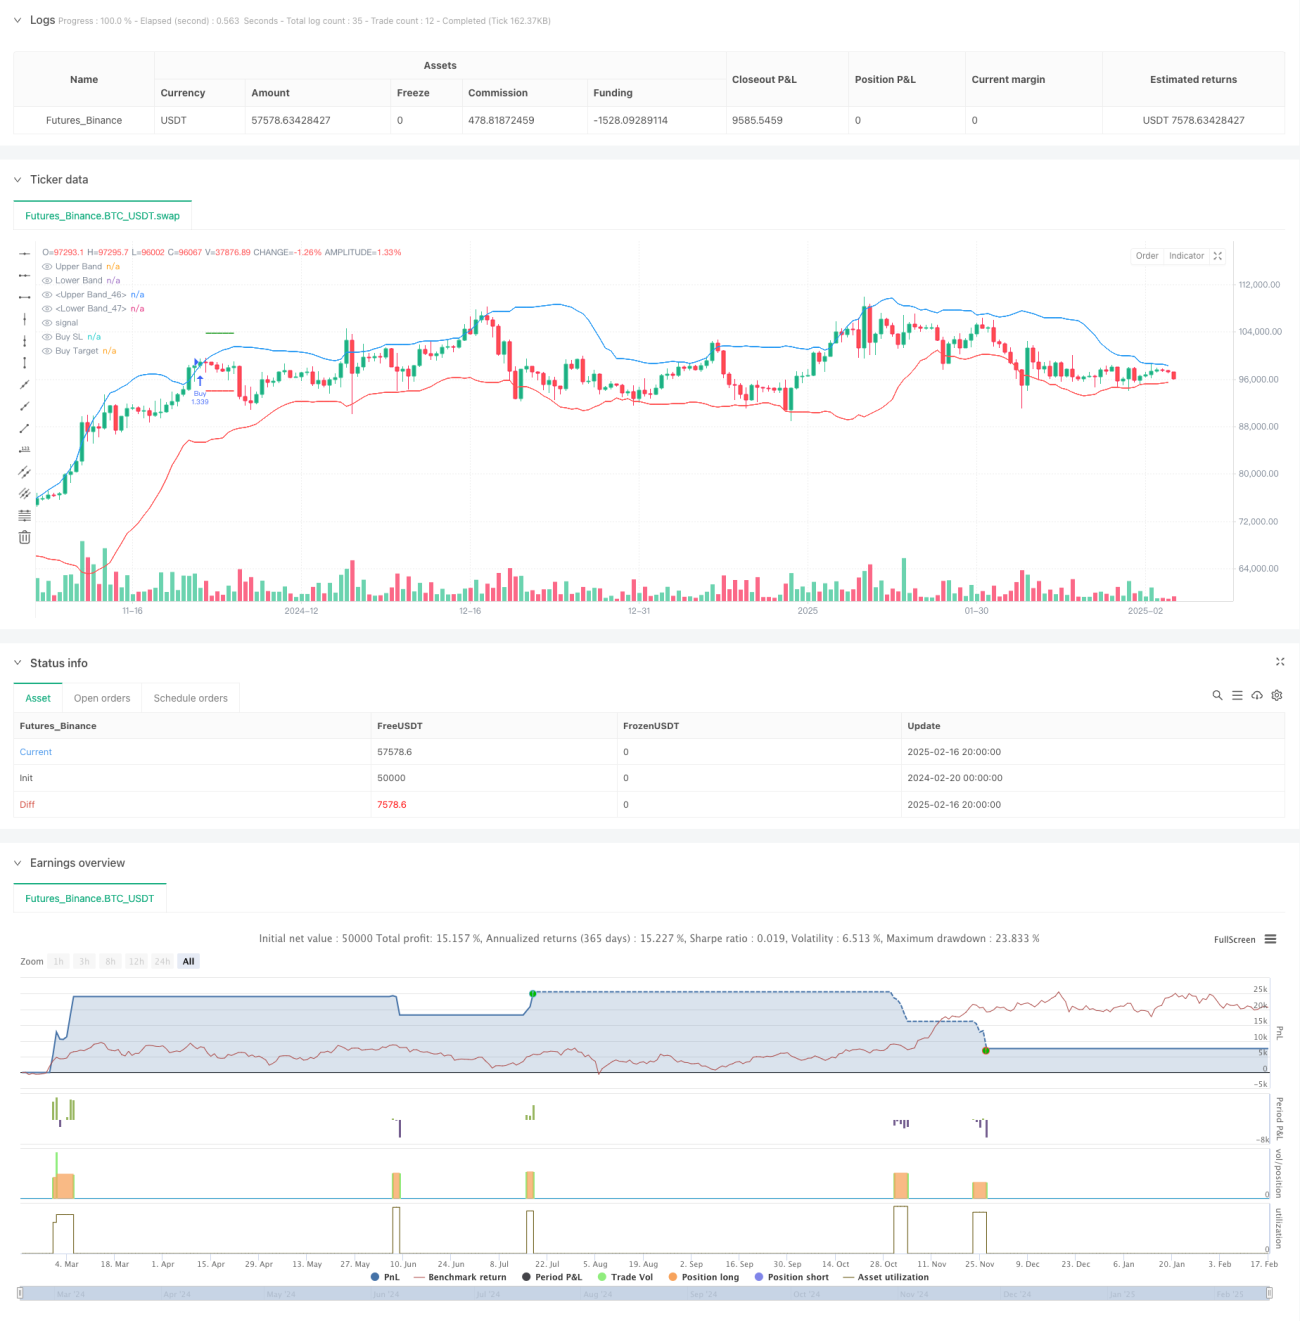
/*backtest
start: 2024-02-20 00:00:00
end: 2025-02-17 08:00:00
period: 12h
basePeriod: 12h
exchanges: [{"eid":"Futures_Binance","currency":"BTC_USDT"}]
*/

//@version=6
strategy("Bollinger Band Strategy (Close Near High/Low Relative to Half Range)", overlay=true, default_qty_type=strategy.percent_of_equity, default_qty_value=200, pyramiding=0)

// Bollinger Bands- 1