Stratégie de trading quantitative améliorée avec suivi des tendances multi-indicateurs

Aperçu
La stratégie est une stratégie de suivi de tendance basée sur plusieurs indicateurs techniques, intégrant plusieurs indicateurs techniques tels que les moyennes mobiles (EMA), les moyennes tendances (ADX) et les indicateurs relativement faibles (RSI), et combinant des méthodes d'analyse multi-temps. La stratégie confirme principalement la direction de la tendance en croisant les EMA rapides et lents, en utilisant l'ADX pour filtrer l'intensité de la tendance, en utilisant le RSI pour juger de la dynamique du marché, ce qui permet de négocier à haute fréquence sur le graphique de 1 minute.
Principe de stratégie
La stratégie fonctionne sur la base des mécanismes clés suivants:
- Utilise les EMA de 50 cycles et 200 cycles pour identifier la direction de la tendance et confirme le signal d'entrée par le croisement des lignes rapides et lentes
- Utilisez l'indicateur ADX (cycle 14) pour évaluer la force de la tendance, n'entrez que lorsque l'ADX est supérieur à 25 pour éviter les chocs du marché
- L'analyse dynamique est effectuée en combinaison avec l'indicateur RSI (14 cycles) et prend en compte les hausses lorsque le RSI est inférieur à 30 et les pertes lorsque le RSI est supérieur à 70
- Introduction de l'analyse EMA sur une période de 4 heures pour renforcer la fiabilité des jugements de tendance par la confirmation sur plusieurs périodes
- Le stop loss est réglé dynamiquement, le stop loss est placé à 5% du prix d'entrée et le stop loss est placé à 2%; le shorting est inversé
Avantages stratégiques
- Vérification croisée multi-indicateurs, amélioration significative de la fiabilité du signal
- Avoir un mécanisme de contrôle des risques bien développé, y compris un arrêt dynamique et une gestion des positions basée sur la volatilité
- L'analyse multi-temps réduit le risque de fausses intrusions
- Un taux de réussite élevé et un ratio de profit/perte modéré, avec de bonnes perspectives de rendement
- La logique de la stratégie est claire, facile à comprendre et à maintenir
Risque stratégique
- Les fluctuations rapides et violentes du marché peuvent entraîner une inefficacité du stop loss.
- La volatilité des marchés horizontaux pourrait entraîner des transactions fréquentes et augmenter les coûts de transaction
- L'EMA est en retard et pourrait rater une opportunité d'entrée
- Plusieurs indicateurs peuvent générer des signaux contradictoires
- Les transactions à 1 minute exigent une vitesse d'exécution élevée et peuvent présenter un risque de glissement
Orientation de l'optimisation de la stratégie
- Optimisation des paramètres de l'ADX pour une meilleure précision de la détection des tendances
- L'introduction d'une gestion dynamique des positions basée sur l'ATR pour mieux s'adapter aux fluctuations du marché
- Augmenter la dimension de l'analyse du volume et améliorer la fiabilité du signal
- Considérer l'ajout d'une classification des environnements de marché, en utilisant une combinaison de paramètres différente dans différentes conditions de marché
- Vous pouvez essayer d'intégrer des algorithmes d'apprentissage automatique pour optimiser la sélection des paramètres.
Résumer
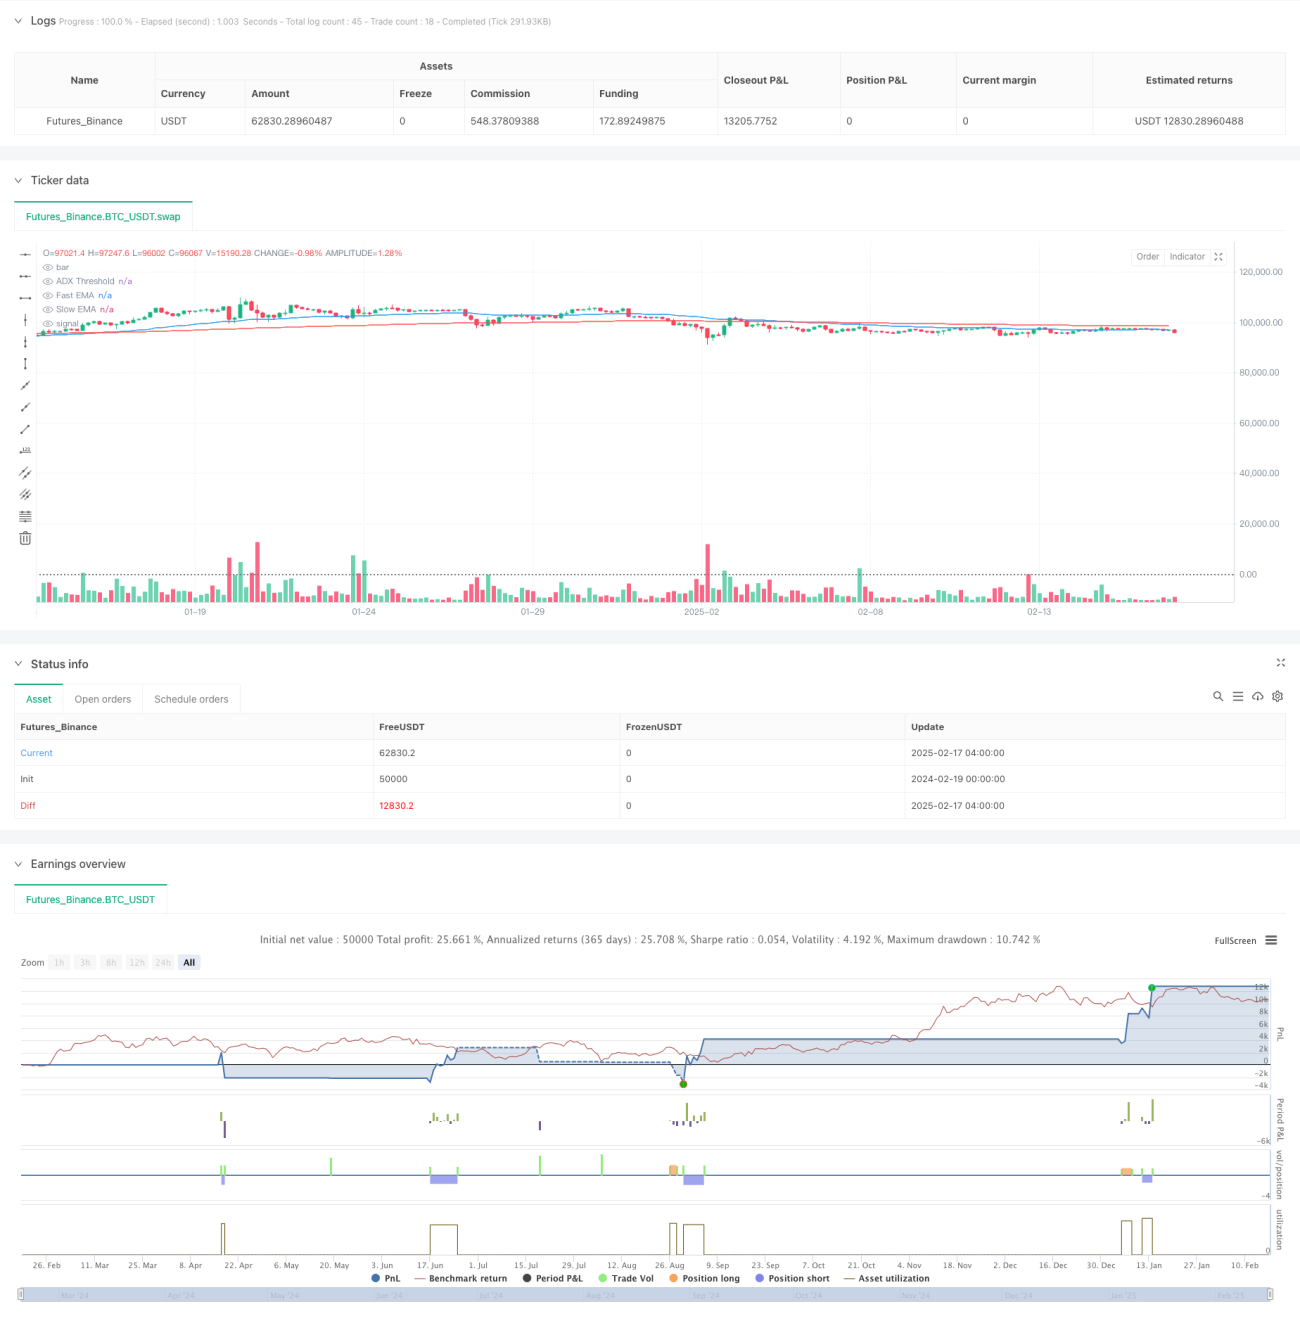
La stratégie a permis de construire un système robuste de suivi des tendances grâce à la synergie de multiples indicateurs techniques. La stratégie a permis de réaliser des gains considérables grâce à un mécanisme de contrôle des risques parfait, tout en maintenant un taux de réussite élevé. Bien qu'il y ait une certaine marge d'optimisation, la performance globale est satisfaisante, particulièrement adaptée aux traders qui recherchent des gains stables.
/*backtest
start: 2024-02-19 00:00:00
end: 2025-02-17 08:00:00
period: 4h
basePeriod: 4h
exchanges: [{"eid":"Futures_Binance","currency":"BTC_USDT"}]
*/

//@version=5
strategy("Enhanced Trend Following Strategy", overlay=true, default_qty_type=strategy.percent_of_equity, default_qty_value=200)

// === INPUTS ===- 1