Stratégie de trading de tendance dynamique à double indicateur : système d'analyse technique multidimensionnelle basé sur le RSI et le MACD
RSI MACD OB(Overbought) OS(Oversold) TA(Technical Analysis)
Date de création:
2025-02-19 17:52:18
Dernière modification:
2025-02-27 17:53:45
Copier:
5
Nombre de clics:
546
2
Suivre
455
Abonnés
Aperçu
Il s’agit d’une stratégie de négociation automatisée basée sur les indicateurs techniques doubles RSI et MACD. Cette stratégie permet d’identifier les opportunités de négociation potentielles en combinant les signaux de survente et de survente avec la confirmation de la tendance.
Principe de stratégie
La logique centrale de la stratégie repose sur les éléments clés suivants:
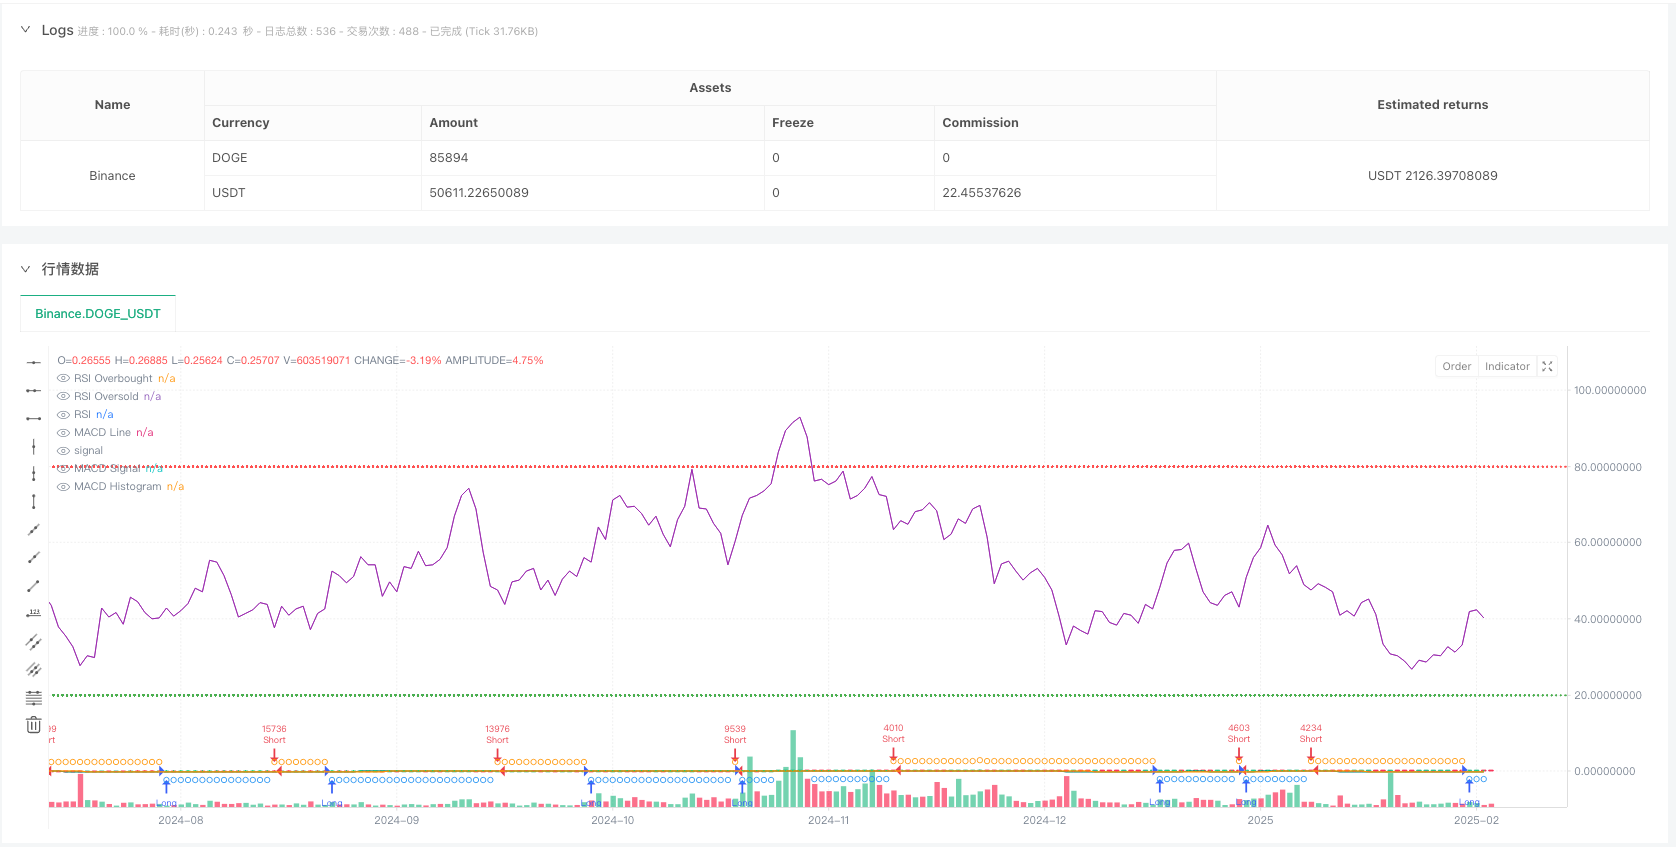
- L’indicateur de force relative (RSI) est utilisé pour juger les surachats et les surventeurs, avec un paramètre de 14 cycles, une valeur de surachat de 80 et une valeur de survente de 20
- Utilisez MACD ((12,26,9) pour la confirmation de tendance et identifiez les changements de tendance par le croisement de la ligne MACD avec la ligne de signal
- La génération d’un signal de trading doit satisfaire à la fois au RSI et au MACD:
- Conditions multiples: le RSI n’a pas encore atteint le niveau de surachat + la ligne MACD est au-dessus de la ligne de signal
- Conditions de mise à découvert: RSI n’a pas atteint le niveau de survente + ligne MACD en dessous de la ligne de signal
- Utilisation de 3% des intérêts du compte comme taille de position par transaction et limitation de la reconstitution de la position pour les transactions simultanées
Avantages stratégiques
- L’utilisation combinée d’indicateurs techniques doubles réduit considérablement le risque de faux signaux et améliore la fiabilité des transactions
- La gestion des positions en pourcentage aide à la dynamique des fonds et à mieux contrôler les risques.
- Un mécanisme anti-points de glissement intégré (en 3 points) améliore l’adaptabilité de la stratégie dans le disque dur
- Une stratégie qui favorise le recours à des opérations de découvert pour profiter pleinement des opportunités du marché
- Les périodes de négociation sont personnalisables pour s’adapter aux différentes caractéristiques du marché
Risque stratégique
- Le RSI et le MACD sont tous deux des indicateurs en retard qui peuvent ne pas réagir assez rapidement dans un marché en évolution rapide.
- Les seuils fixes de survente et de survente peuvent nécessiter des ajustements dans différentes conditions de marché.
- Une position fixe de 3% peut être trop grande ou trop petite dans certains cas
- Aucune condition de stop loss n’est définie, ce qui peut entraîner un renversement des bénéfices ou une expansion des pertes
- Les conditions strictes de l’indicateur binaire pourraient faire passer à côté de certaines opportunités de négociation potentielles.
Orientation de l’optimisation de la stratégie
- Introduction d’une marge RSI adaptative, un critère de jugement de surachat et de survente ajusté en fonction de la dynamique de la volatilité du marché
- Ajout d’un mécanisme d’arrêt de perte, avec recommandation de régler le stop-loss dynamique en fonction de l’ATR ou de la volatilité
- Optimiser le système de gestion des positions, en tenant compte de la volatilité du marché et de l’évolution dynamique de la valeur nette des comptes
- Ajout de filtres d’environnement de marché pour ajuster les paramètres de stratégie ou suspendre les transactions dans des conditions de marché différentes
- Considérer l’introduction d’indicateurs de trafic comme confirmation auxiliaire pour améliorer la fiabilité du signal
Résumer
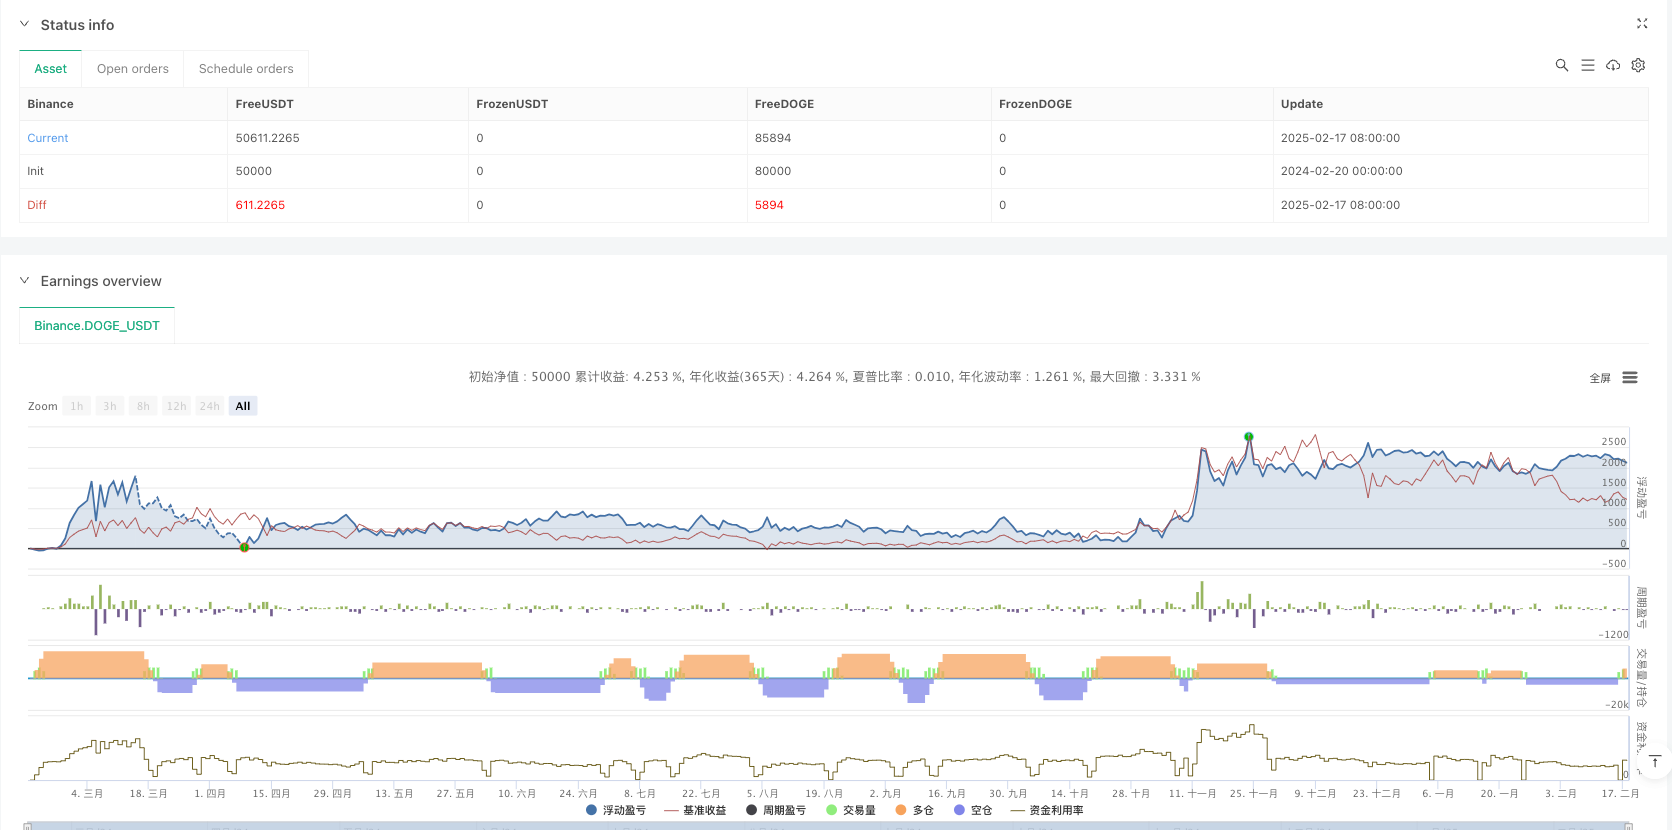
La stratégie a une bonne valeur pratique grâce à un contrôle raisonnable des risques et à l’optimisation des paramètres. Il est recommandé de faire un retour d’expérience suffisant avant l’application en direct et d’optimiser de manière ciblée en fonction des caractéristiques spécifiques du marché.
Code source de la stratégie
//@version=6
strategy("Debugging Demo GPT",
         overlay=true,
         initial_capital=100,
         default_qty_type=strategy.percent_of_equity,
         default_qty_value=3,
         pyramiding=1,
         calc_on_order_fills=true,
         calc_on_every_tick=true,
         slippage=3)

// -----------------------------------------------------------------------
//   (1) Inputs: Start and End Date
// -----------------------------------------------------------------------


// -----------------------------------------------------------------------
//   (2) Indicators (RSI, MACD)
// -----------------------------------------------------------------------

// === RSI ===
rsiLen = input.int(14, "RSI Length")
rsiOB  = input.int(80, "RSI Overbought")
rsiOS  = input.int(20, "RSI Oversold")
rsiVal = ta.rsi(close, rsiLen)

// === MACD ===
fastLen  = input.int(12, "MACD Fast Length")
slowLen  = input.int(26, "MACD Slow Length")
sigLen   = input.int(9,  "MACD Signal Length")
[macdLine, sigLine, histLine] = ta.macd(close, fastLen, slowLen, sigLen)

// -----------------------------------------------------------------------
//   (3) Trading Logic: LONG/SHORT Filters
// -----------------------------------------------------------------------

bool rsiLongOk   = (rsiVal < rsiOB)
bool rsiShortOk  = (rsiVal > rsiOS)
bool macdLongOk  = (macdLine > sigLine)
bool macdShortOk = (macdLine < sigLine)

bool longCondition  = rsiLongOk and macdLongOk
bool shortCondition = rsiShortOk and macdShortOk

// -----------------------------------------------------------------------
//   (4) Entry Conditions
// -----------------------------------------------------------------------

// Debugging: Visualizing the conditions
plotshape(series=longCondition, location=location.belowbar, color=color.blue, style=shape.circle, title="LongCondition", size=size.tiny)
plotshape(series=shortCondition, location=location.abovebar, color=color.orange, style=shape.circle, title="ShortCondition", size=size.tiny)

// Entries only when all conditions are met
if longCondition
    strategy.entry("Long", strategy.long)
if shortCondition
    strategy.entry("Short", strategy.short)

// -----------------------------------------------------------------------
//   (5) Plotting for Visualization
// -----------------------------------------------------------------------

// RSI Plots
hline(rsiOB, "RSI Overbought", color=color.red, linestyle=hline.style_dotted)
hline(rsiOS, "RSI Oversold", color=color.green, linestyle=hline.style_dotted)
plot(rsiVal, title="RSI", color=color.purple)

// MACD Plots
plot(macdLine, color=color.teal, title="MACD Line")
plot(sigLine, color=color.orange, title="MACD Signal")
plot(histLine, style=plot.style_histogram, color=(histLine >= 0 ? color.lime : color.red), title="MACD Histogram")