Stratégie de suivi de tendance dynamique multi-périodes combinant les indicateurs EMA et ADX

Aperçu
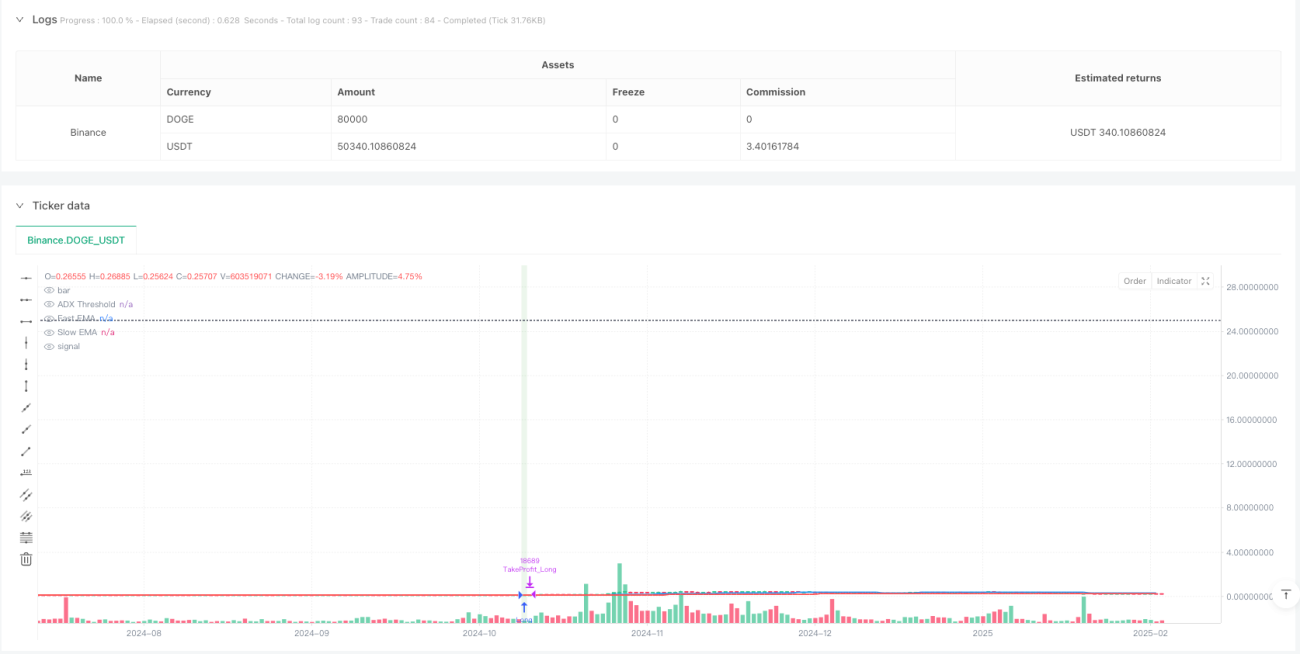
La stratégie est un système de trading de suivi de tendance combinant l'analyse de plusieurs périodes de temps, en intégrant plusieurs indicateurs techniques tels que les moyennes mobiles de l'indice (EMA), l'indice de tendance moyen (ADX) et l'indice de force relative (RSI) pour effectuer des transactions sur une période de 15 minutes. La stratégie utilise une méthode de gestion de position conservatrice, le risque par transaction est contrôlé à moins de 2% du total du compte, pour obtenir des gains stables à long terme.
Principe de stratégie
La stratégie utilise un croisement des EMA rapides (en 50 cycles) et des EMA lentes (en 200 cycles) pour identifier la direction de la tendance, et en combinaison avec l'indicateur ADX pour confirmer la force de la tendance. Lorsque le nombre d'ADX est supérieur à 25, le marché est dans un état de forte tendance.
Avantages stratégiques
- L'intégration de plusieurs indicateurs techniques réduit l'impact des faux signaux et améliore la fiabilité des transactions.
- Le système de stop-loss est configuré de manière dynamique et peut être adapté aux fluctuations du marché.
- Une stratégie de gestion de position conservatrice (contrôle du risque de 2%) a permis de réduire efficacement le risque de retrait.
- L'analyse de plusieurs périodes offre une perspective plus complète sur les tendances du marché.
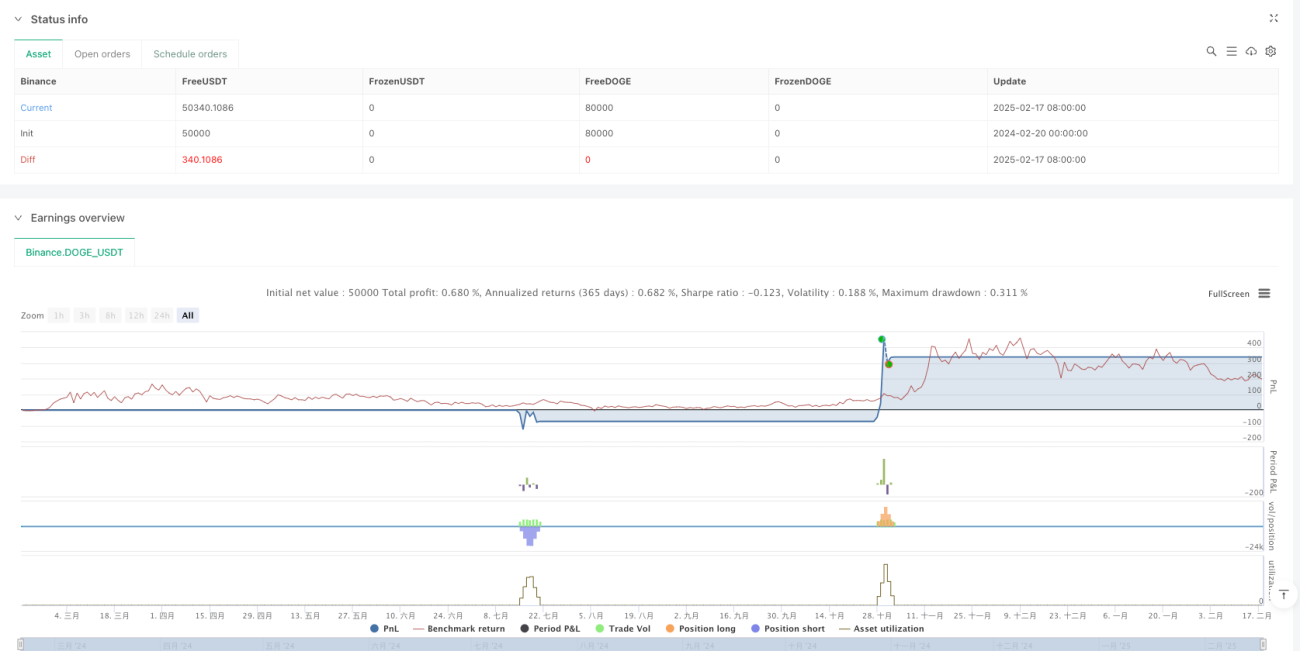
- Le retrait de la stratégie indique un taux de victoire de 62,86% et un facteur de profit de 1,136.
Risque stratégique
- Les signaux de transaction peuvent être fréquents dans les marchés en crise, augmentant les coûts de transaction.
- La stratégie croisée de l'EMA peut être retardée dans un revirement rapide.
- Une dépendance excessive à l'égard des indicateurs techniques peut négliger les effets des facteurs fondamentaux.
- Les seuils fixes d'ADX peuvent avoir des performances incohérentes selon les conditions du marché.
Orientation de l'optimisation de la stratégie
- L'introduction d'indicateurs de volatilité (comme l'ATR) pour ajuster dynamiquement le niveau de stop loss.
- Considérer l'ajout d'indicateurs de volume de transactions comme confirmation supplémentaire du signal de transaction.
- Développer des systèmes de dépréciation ADX adaptés aux différents environnements de marché.
- L'ajout d'indicateurs de l'humeur du marché pour améliorer la précision de l'heure d'entrée.
- Optimiser la sélection de cycles sur plusieurs périodes de temps pour trouver la combinaison optimale.
Résumer
La stratégie affiche un bon potentiel de négociation grâce à une méthode d'analyse technique multidimensionnelle et à des contrôles rigoureux des risques. Bien que la performance soit stable dans les retours d'expérience, elle nécessite encore une vérification complète dans un environnement réel. La conception modulaire de la stratégie lui confère une plus grande adaptabilité et un espace d'optimisation, permettant un ajustement flexible en fonction des changements du marché.
- 1