
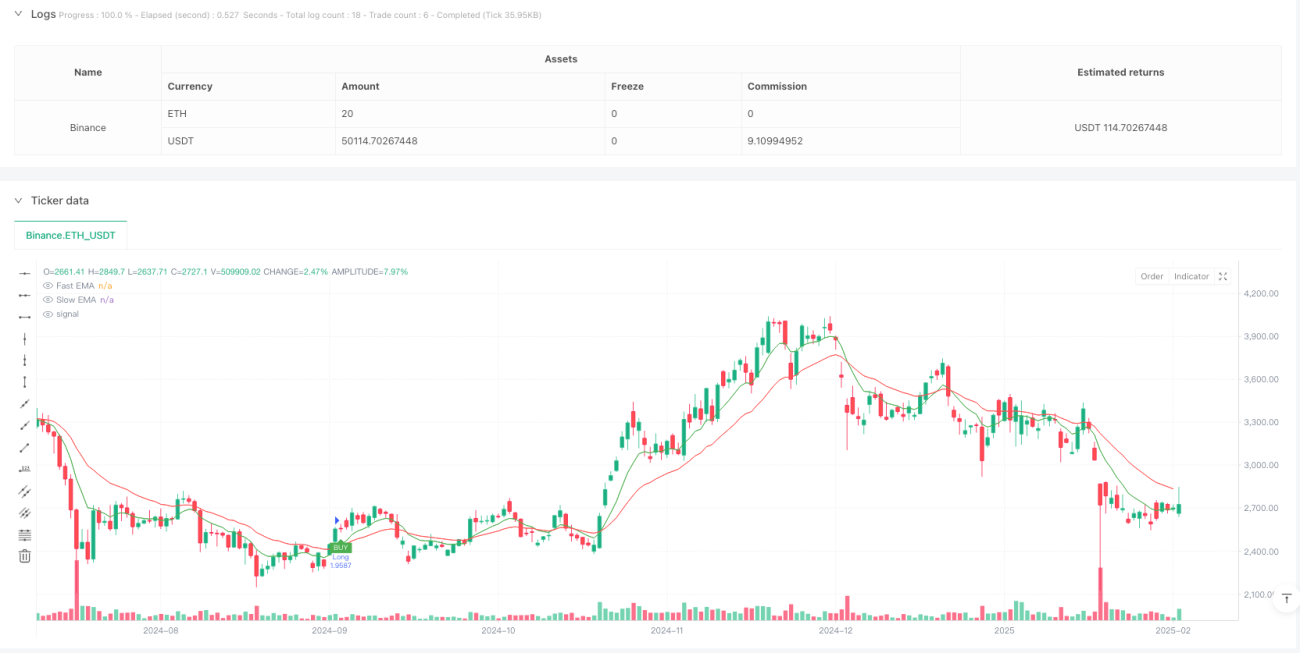
Aperçu
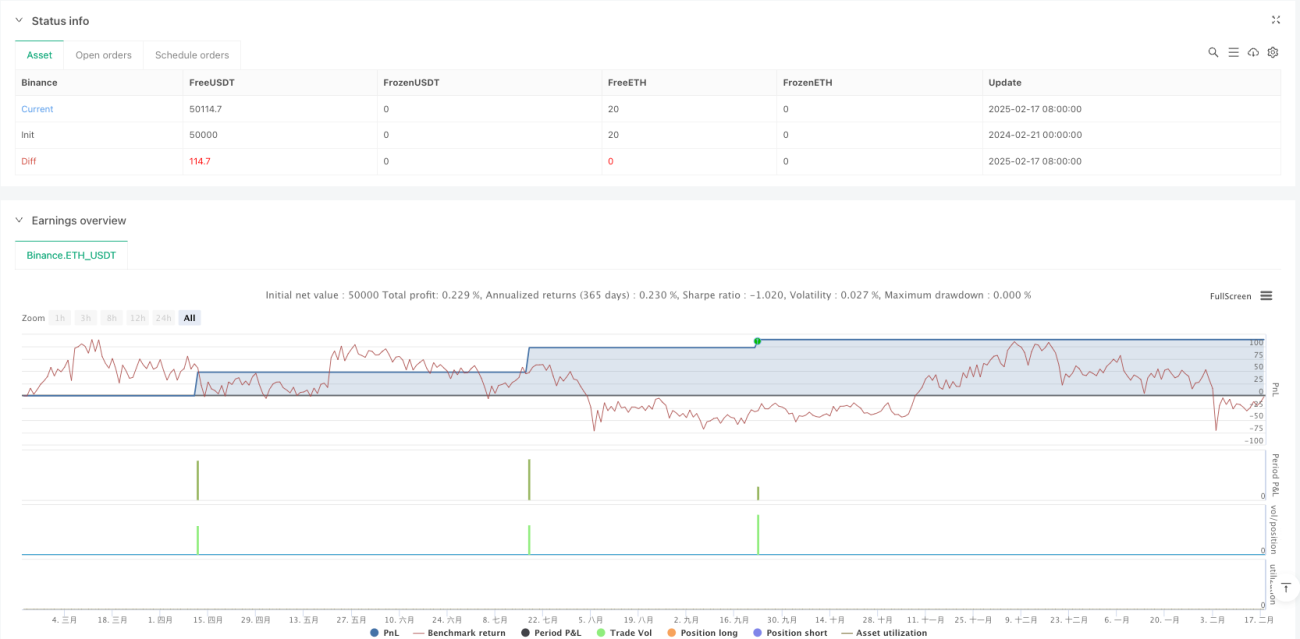
Cette stratégie est une stratégie multi-points de marché en temps réel basée sur plusieurs indicateurs techniques. Elle utilise principalement les signaux croisés des moyennes mobiles rapides et lentes (EMA) en combinaison avec l'indice relativement faible (RSI), l'indice de tendance moyenne (ADX) et l'indice de tendance moyenne mobile (MACD) pour confirmer les signaux de négociation. La stratégie utilise également l'amplitude moyenne réelle (ATR) pour définir des niveaux de stop et d'arrêt dynamiques, pour la gestion du risque.
Principe de stratégie
La logique fondamentale de la stratégie repose sur les éléments clés suivants :
- Utilisation d'un croisement EMA de 8 cycles et de 21 cycles comme signal d'entrée principal
- Confirmation de l'intensité de la tendance par l'ADX> 25
- Utilisation de la fourchette MACD pour déterminer la direction de la tendance
- Le RSI < 70 est utilisé pour éviter d'entrer dans une zone de survente.
- Utilisez 1,5 fois l'ATR comme arrêt et 2 fois l'ATR comme arrêt.
- La mise en place d'un mécanisme de suivi des pertes afin d'assurer le blocage des bénéfices
Avantages stratégiques
- Le mécanisme de confirmation multiple a considérablement amélioré la fiabilité des transactions
- Les paramètres de stop loss et de stop stop sont adaptés aux fluctuations du marché
- Fonction de suivi des pertes et de protection des profits réalisés
- Exécution des transactions uniquement après confirmation de la ligne K, pour réduire les faux signaux
- Le taux de détention des fonds est utilisé pour mieux contrôler les risques
- Le coût de transaction est pris en compte, ce qui est plus conforme à l'environnement de transaction réel.
Risque stratégique
- La multiplication des indicateurs pourrait entraîner la perte de certaines opportunités commerciales
- Les marchés en évolution rapide peuvent générer de fréquents faux signaux
- Un saut en hauteur peut entraîner une panne d'arrêt
- Les coûts de transaction peuvent affecter le rendement global de la stratégie
- Les stratégies unidirectionnelles peuvent être moins efficaces en période de baisse
Orientation de l'optimisation de la stratégie
- On peut envisager d'ajouter des filtres d'environnement de marché pour ajuster les paramètres selon les différentes conditions du marché
- L'introduction de l'indicateur de quantité d'acheminement comme signal de confirmation supplémentaire
- Optimisation des paramètres EMA et MACD pour les rendre plus adaptés aux différentes périodes
- Amélioration du mécanisme de prévention des pertes par lots
- Augmentation de la logique de gestion de position pour un contrôle de position plus flexible
Résumer
Il s'agit d'une stratégie de suivi de tendance conçue de manière rationnelle, en utilisant la combinaison de multiples indicateurs techniques, pour rechercher des gains stables tout en contrôlant les risques. L'avantage de la stratégie réside dans son mécanisme de confirmation et son système de gestion des risques, mais elle nécessite toujours une optimisation des paramètres et des améliorations logiques en fonction de la situation réelle du marché.
/*backtest
start: 2024-02-21 00:00:00
end: 2025-02-18 08:00:00
period: 1d
basePeriod: 1d
exchanges: [{"eid":"Binance","currency":"ETH_USDT"}]
*/

//@version=6
strategy("Optimized Long-Only Strategy (Spot Market) - Candle Signals Only", overlay=true, initial_capital=10000, default_qty_type=strategy.percent_of_equity, default_qty_value=10, commission_type=strategy.commission.percent, commission_value=0.1)

// INPUTS- 1