Aperçu
La stratégie est un système de trading de suivi de tendance combinant plusieurs indicateurs techniques. Elle est principalement basée sur les signaux croisés des moyennes mobiles simples (SMA) et des moyennes mobiles indicielles (EMA) et intègre plusieurs caractéristiques avancées telles que la bande de tendance des moyennes mobiles de Hull (HMA), l’indicateur William (%R) et l’analyse des hauts et des bas de swing pour fournir des signaux de trading plus fiables grâce à un mécanisme de filtrage dynamique.
Principe de stratégie
La logique centrale de la stratégie repose sur les éléments clés suivants:
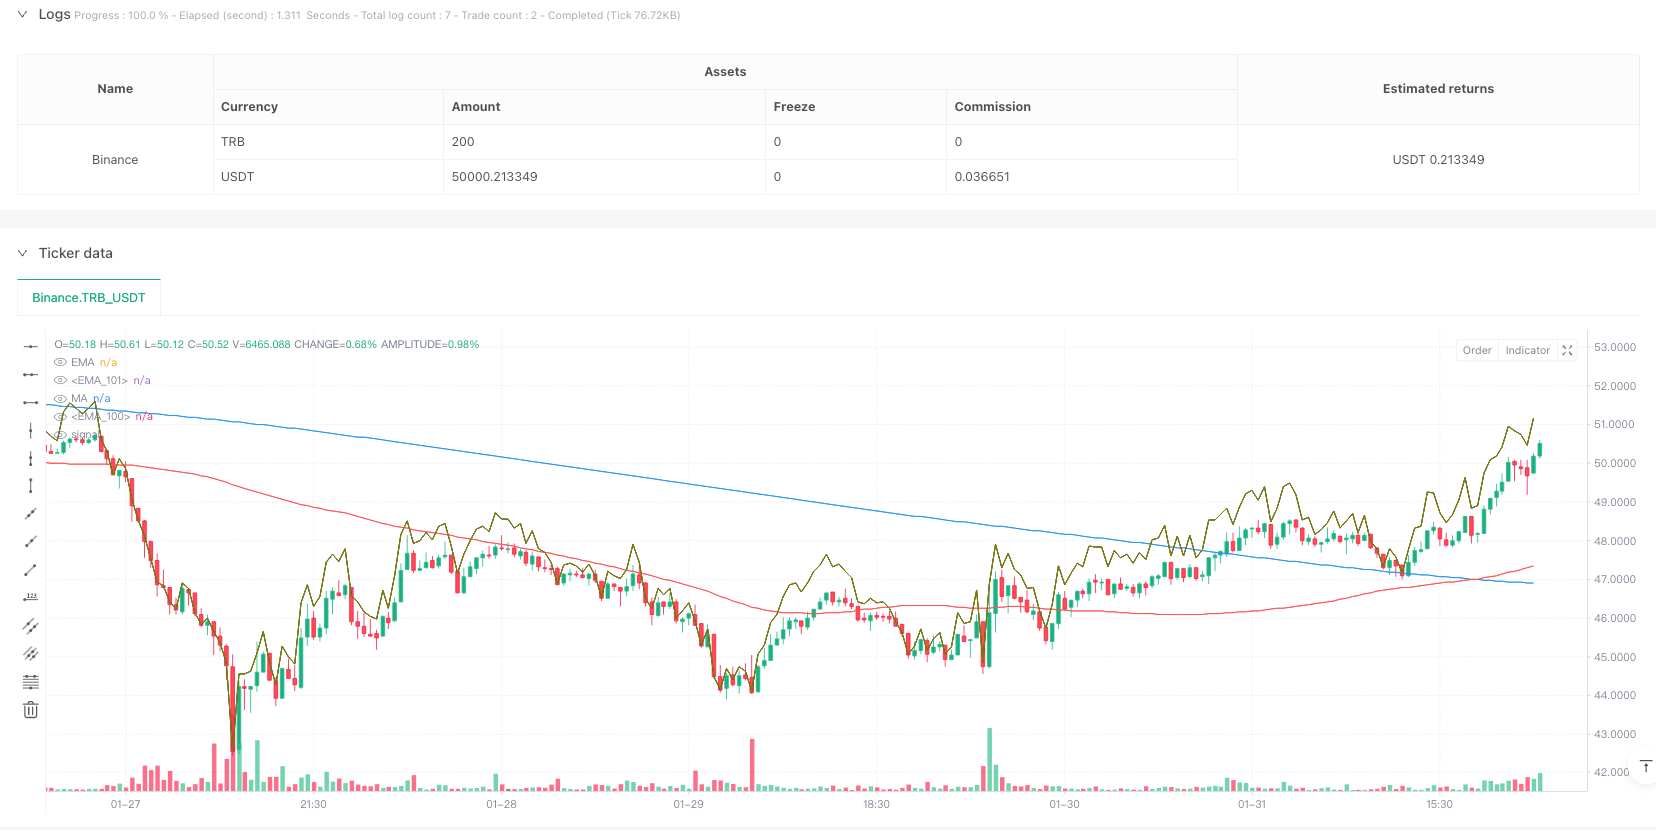
- Utilisez le SMA de 100 cycles et l’EMA de 200 cycles comme indicateurs principaux de tendance
- La bande de tendance HMA intégrée à 70 cycles est utilisée pour confirmer la dynamique de la tendance
- Calcul de la position dynamique de support/résistance avec l’indicateur de William ((%R)
- Détection des hauts et des bas à travers une fenêtre de rétroaction de 20 cycles
- Surveillance et mises à jour en temps réel
- Réglez le filtrage au début de l’ouverture et le seuil d’oscillation de ± 0,5% pour réduire les faux signaux
Les conditions d’entrée doivent être remplies en même temps: double ligne moyenne sur la station de prix, l’indicateur% R a augmenté de 3 lignes K consécutives et est supérieur à 20, la ligne K se ferme et le prix de clôture est supérieur au précédent, le prix ne dépasse pas la limite de fluctuation de la journée. Les conditions de sortie doivent satisfaire à l’une des conditions suivantes: le prix est inférieur à la moyenne binaire, l’indicateur %R est inférieur à -80
Avantages stratégiques
- La vérification simultanée de plusieurs indicateurs techniques améliore la fiabilité des signaux de transaction
- Le mécanisme de filtrage dynamique réduit efficacement les faux signaux pendant les périodes de forte volatilité.
- Le calcul de la résistance au support auto-adaptatif permet une bonne adaptabilité de la stratégie au marché
- Un mécanisme complet de gestion des transactions intra-journalières, comprenant un filtrage au début de l’ouverture et un contrôle des seuils de volatilité
- Les paramètres sont réglables et peuvent être optimisés en fonction des différentes conditions du marché
Risque stratégique
- Les systèmes de régularisation peuvent générer de faux signaux fréquents dans les marchés en crise.
- Le filtrage multiconditionnel peut entraîner la perte d’opportunités commerciales potentielles
- Les cycles de la moyenne mobile fixe peuvent varier selon les conditions du marché.
- Le filtrage des transactions intrajournalières pourrait être une occasion manquée dans un contexte de tendances rapides
- L’optimisation excessive des paramètres peut entraîner des problèmes de suradaptation
Orientation de l’optimisation de la stratégie
- L’introduction d’un mécanisme de calcul du cycle de la moyenne linéaire qui s’adapte, permettant au système de mieux s’adapter aux fluctuations du marché
- Augmentation des indicateurs d’analyse du volume des transactions pour améliorer la fiabilité de la détection des tendances
- Développer des mécanismes d’arrêt et d’arrêt dynamiques pour améliorer l’efficacité de la gestion des fonds
- Ajout d’un indicateur de volatilité du marché pour optimiser les paramètres de seuil de filtrage
- Prendre en compte la synchronisation des signaux sur différentes périodes de temps, renforcer la stabilité du système
Résumer
Il s’agit d’un système de trading de suivi de tendances bien conçu, qui maintient une bonne flexibilité tout en garantissant la fiabilité grâce à la combinaison de multiples indicateurs techniques et à un mécanisme de filtrage strict. La marge d’optimisation de la stratégie réside principalement dans l’auto-adaptation des paramètres et l’amélioration du mécanisme de gestion des risques.
/*backtest
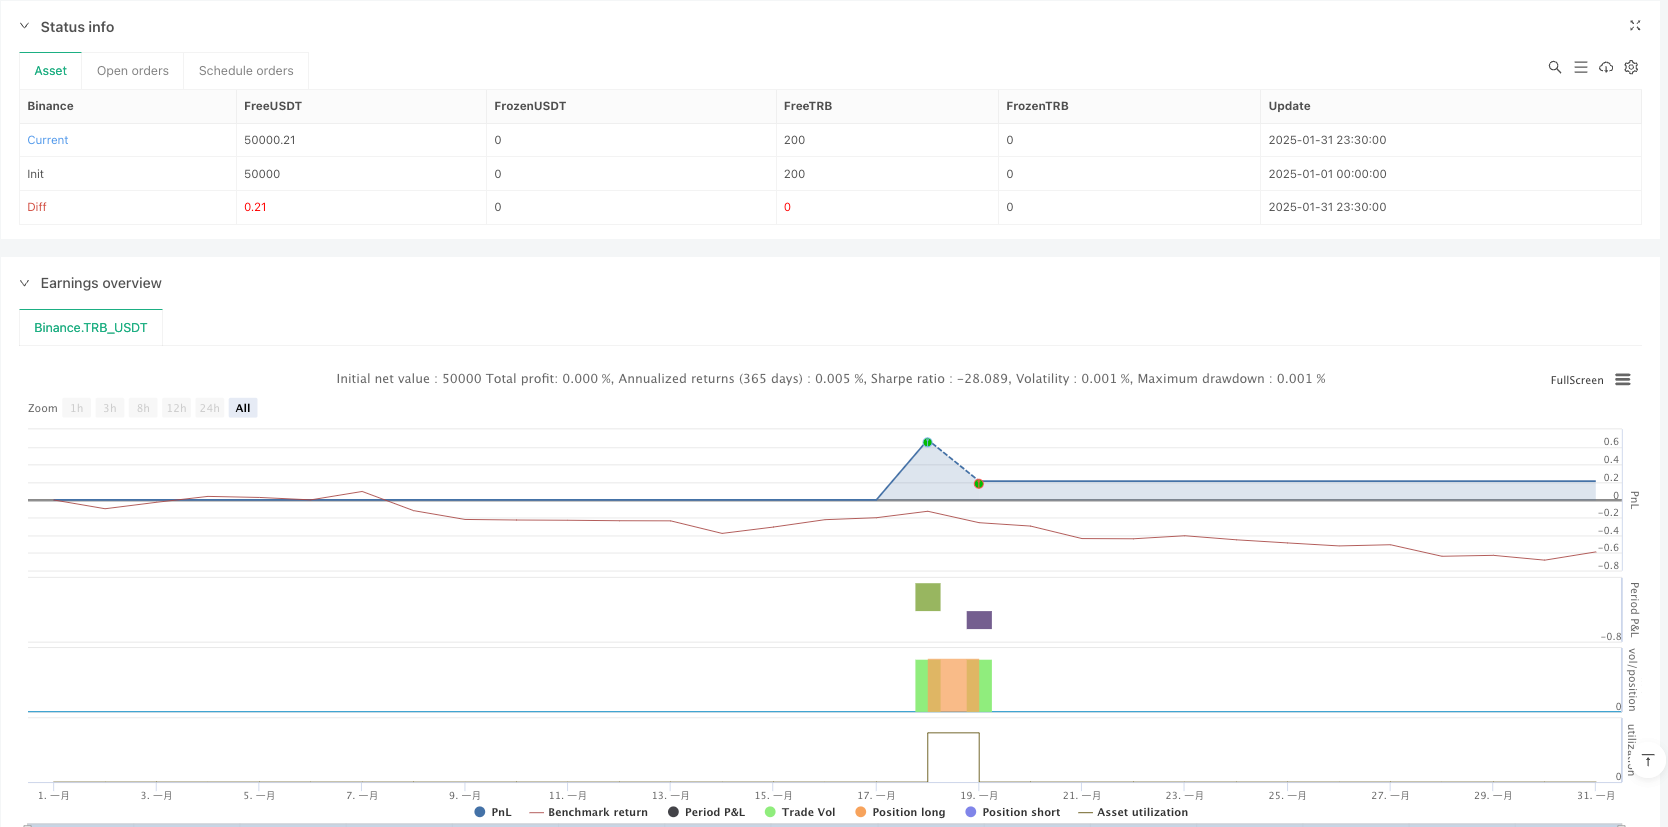
start: 2025-01-01 00:00:00
end: 2025-01-31 23:59:59
period: 30m
basePeriod: 30m
exchanges: [{"eid":"Binance","currency":"TRB_USDT"}]
*/
//@version=5
strategy(title="EMA & MA Crossover Strategy", shorttitle="EMA & MA Crossover Strategy", overlay=true)
// Inputs
LengthMA = input.int(100, minval=1, title="MA Length")
LengthEMA = input.int(200, minval=1, title="EMA Length")
swingLookback = input.int(20, title="Swing Lookback")
Lengthhmaribbon = input.int(70, minval=1, title="HMA Ribbon")
// Input for ignoring the first `n` candles of the day
ignore_n_candles = input.int(1, "Ignore First N Candles", minval=0)
// Input for percentage threshold to ignore high run-up candles
run_up_threshold = input.float(0.5, "Run-up Threshold (%)", minval=0.0)
//====================================================================
hmacondition = ta.hma(close,Lengthhmaribbon)> ta.hma(close,Lengthhmaribbon)[1]
//====================================================================
// Function to drop the first `n` candles
dropn(src, n) =>
na(src[n]) ? na : src
// Request data with the first `n` candles dropped
valid_candle = not na(dropn(close, ignore_n_candles))
// Check for run-up condition on the previous candle
prev_run_up = (high[1] - low[1]) / low[1] * 100
// Combine conditions: exclude invalid candles and ignore high run-up candles
valid_entry_condition = valid_candle and prev_run_up <= run_up_threshold
//======================================================
// Define the start of a new day based on time
var is_first = false
var float day_high = na
var float day_low = na
// Use time() to detect the start of a new day
t = time("1440") // 1440 = 60 * 24 (one full day in minutes)
is_first := na(t[1]) and not na(t) or t[1] < t
if is_first and barstate.isnew
day_high := high
day_low := low
else
day_high := nz(day_high[1], high)
day_low := nz(day_low[1], low)
// Update daily high and low
if high > day_high
day_high := high
if low < day_low
day_low := low
//====================================================
previousdayclose = request.security(syminfo.tickerid, "D", close)
day_highrange = previousdayclose*.018
//======================================================
length = input(title="Length", defval=14)
src = input(close, "Source")
_pr(length) =>
max = ta.highest(length)
min = ta.lowest(length)
100 * (src - max) / (max - min)
percentR = _pr(length)
//======================================================
higherline = close* 1+((100-(percentR*-1))/100)
lowerline = close* 1-((100-(percentR*-1))/100)
//======================================================
// Moving Averages
xMA = ta.sma(close, LengthMA)
xEMA = ta.sma(xMA, LengthEMA)
// Plot the MA and EMA lines
plot(xMA, color=color.red, title="MA")
plot(xEMA, color=color.blue, title="EMA")
// Find recent swing high and low
recentHigh = ta.highest(high, swingLookback)
recentLow = ta.lowest(low, swingLookback)
//===============================================
emacondition = ta.ema(close,20)>ta.ema(close,30) and ta.ema(close,30)>ta.ema(close,40) and ta.ema(close,40)>ta.ema(close,50) and close >ta.ema(close,20)
// Define Buy Condition
buyCondition1 = (percentR>percentR[1] and percentR[1]>percentR[2] and percentR[2]>percentR[3]) and percentR>-20 and percentR[1]>-20
buyCondition = (close> xMA and close> xEMA) and (close > open and close > close[1]) or xMA>xEMA and close<day_highrange and hmacondition and emacondition
// Define Sell Conditions
sellCondition = (close < xMA and close < xEMA) or xMA<xEMA or percentR<-80
// Strategy Execution
if (buyCondition and buyCondition1 and valid_entry_condition)
strategy.entry("Buy", strategy.long)
if (sellCondition)
strategy.close("Buy") // Close the long position
// Candle coloring for buy/sell indication
barcolor(buyCondition ? color.green : sellCondition ? color.red : na)
plot(higherline, color=color.olive, title="EMA")
plot(higherline, color=color.black, title="EMA")