Stratégie avancée d'inversion de la dynamique à double moyenne mobile : système de trading collaboratif RSI et bandes de Bollinger

Aperçu
La stratégie est un système de trading d'analyse technique avancée qui combine des indicateurs relativement faibles (RSI) et des bandes de bullings (BB). En utilisant ces deux indicateurs de manière synchrone, la stratégie recherche des opportunités de revers avec une forte probabilité dans les zones de survente et de survente du marché.
Principe de stratégie
La logique centrale de la stratégie repose sur la synergie de deux indicateurs techniques majeurs:
- Les bandes de Brin utilisent une moyenne mobile simple à 20 cycles comme voie médiane, avec des voies supérieures et inférieures plus deux fois l'écart-type, respectivement, pour identifier la zone de fluctuation des prix.
- Le RSI utilise une partie de la configuration de 14 cycles, avec 30 comme niveau de survente et 70 comme niveau de survente, pour juger de la dynamique du marché.
- Il y a plusieurs conditions à remplir: le RSI a dépassé 30 et le prix a touché ou est en dessous de la ligne de descente de Brin.
- Les conditions d'aération doivent être remplies en même temps: le RSI a dépassé 70 et le prix a touché ou dépassé la bande de Brin.
- Les conditions de plage comprennent: le RSI dépasse les extrêmes inverses ou le prix dépasse le milieu de la bande de Brin.
Avantages stratégiques
- Mécanisme de double confirmation: utilisation conjointe du RSI et des bandes de Brin pour fournir un signal de négociation plus fiable.
- Adaptabilité: les bandes de Brin s'adaptent automatiquement à la fluctuation du marché.
- Le risque est bien maîtrisé: les conditions d'entrée et de sortie sont clairement définies et les transactions excessives sont évitées.
- La stratégie fournit des indications visuelles claires qui aident les traders à comprendre l'état du marché.
- Adaptabilité des paramètres: les paramètres clés peuvent être optimisés en fonction des différentes caractéristiques du marché.
Risque stratégique
- Risque de choc des marchés: Faux signaux de rupture peuvent être fréquents sur les marchés à la hausse.
- Risque de marché tendanciel: dans une tendance forte, les signaux de retournement peuvent conduire à une liquidation prématurée.
- Sensitivité des paramètres: différents paramètres peuvent être définis dans différents environnements de marché.
- Risque de glissement: dans les marchés moins liquides, le prix de transaction réel peut être dévié du prix du signal.
- Risque systémique: risque de retrait plus important en cas de forte volatilité du marché.
Orientation de l'optimisation de la stratégie
- Ajout d'un filtre de tendance: introduire des indicateurs de tendance supplémentaires pour éviter de faire des transactions inverses dans une tendance forte.
- Adaptation des paramètres d'optimisation: développer des mécanismes d'ajustement des paramètres dynamiques pour mieux adapter les stratégies aux changements du marché.
- Amélioration de la gestion des risques: ajout d'objectifs de stop loss et de profit dynamiques
- Augmentation de l'analyse du volume des transactions: la combinaison des indicateurs de volume des transactions améliore la fiabilité du signal.
- Développer l'identification des environnements de marché: mettre en place un système de classification des états du marché, en utilisant différents paramètres dans différentes conditions de marché.
Résumer
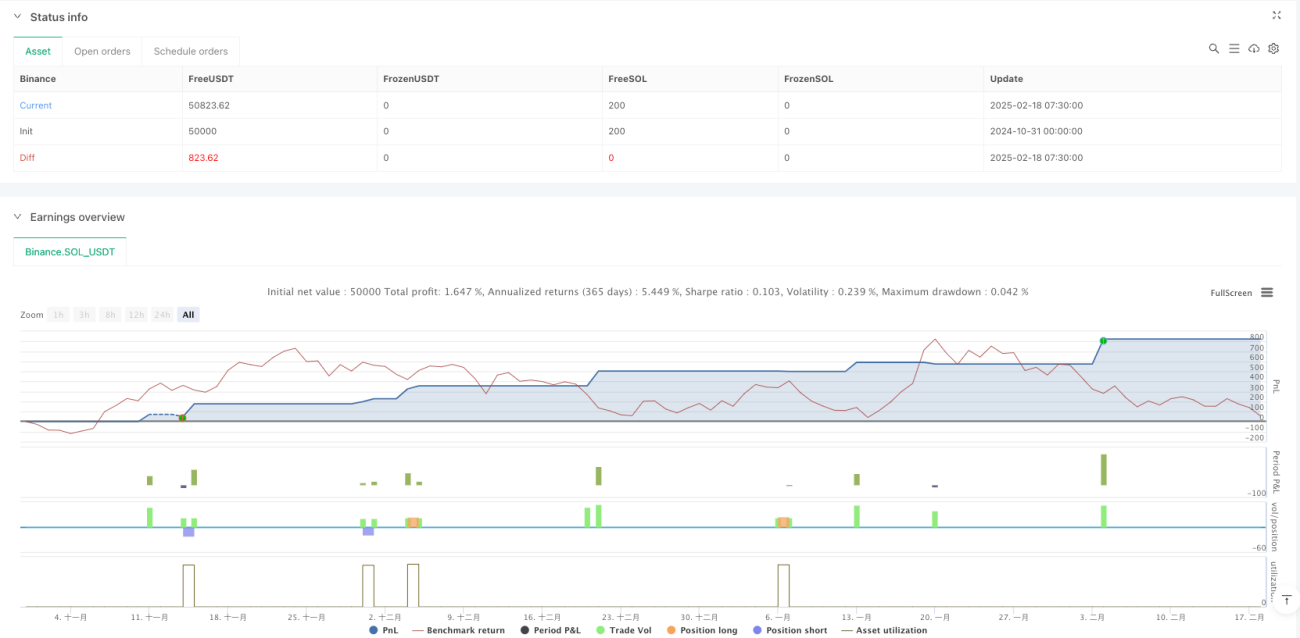
La stratégie construit un système de négociation complet grâce à la synergie entre le RSI et les bandes de Brin. Elle fournit non seulement des signaux d'entrée et d'exit clairs, mais dispose également d'un bon mécanisme de contrôle des risques. Bien que certains risques inhérents existent, la stratégie est susceptible de maintenir une performance stable dans différents environnements de marché grâce à une optimisation et à une amélioration continues.
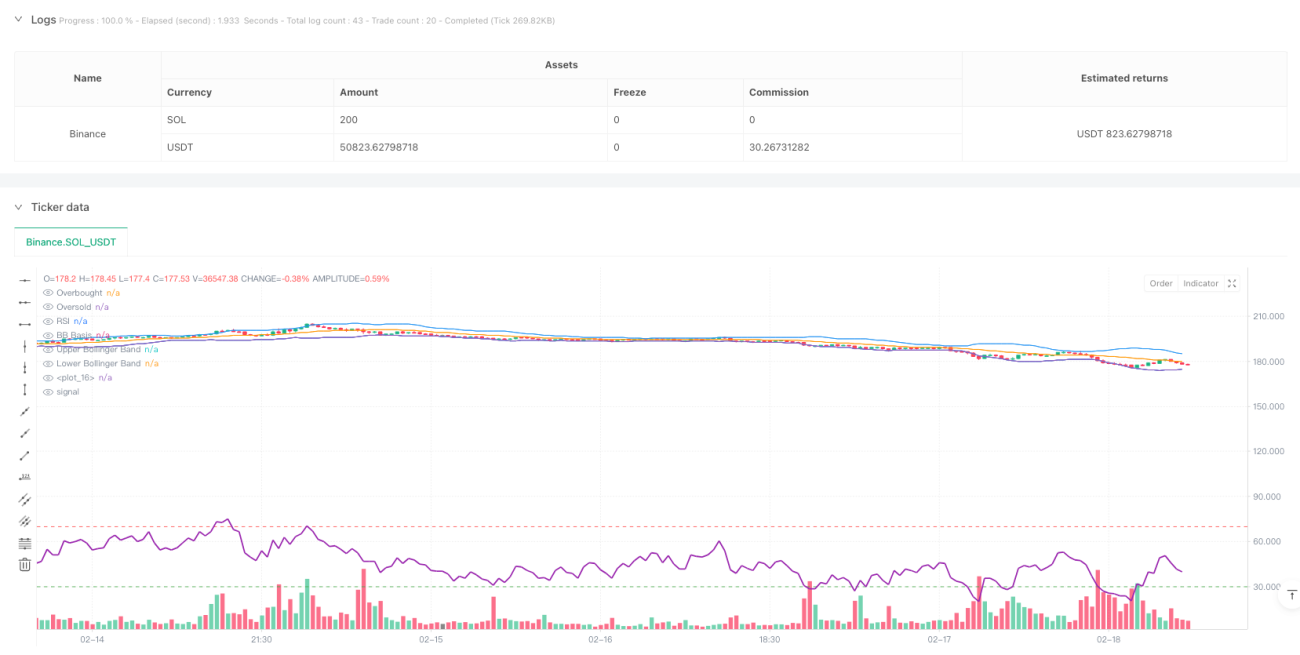
/*backtest
start: 2024-10-31 00:00:00
end: 2025-02-18 08:00:00
period: 30m
basePeriod: 30m
exchanges: [{"eid":"Binance","currency":"SOL_USDT"}]
*/

//@version=5
strategy("RSI + Bollinger Bands Strategy", overlay=true, default_qty_type=strategy.percent_of_equity, default_qty_value=10)

// Bollinger Bands Settings- 1