Aperçu
La stratégie est un système de négociation intégré basé sur l’analyse technique, combinant des zones de résistance de soutien, des formes de graphique et une analyse de la structure du marché. La stratégie prend des décisions de négociation en identifiant les niveaux de prix critiques, en confirmant les signaux de graphique et en évaluant les tendances globales du marché. Le système utilise un rapport risque/bénéfice de 1: 3 pour gérer le risque grâce à des objectifs de stop-loss et de profit prédéfinis.
Principe de stratégie
La logique centrale de la stratégie est basée sur les éléments clés suivants:
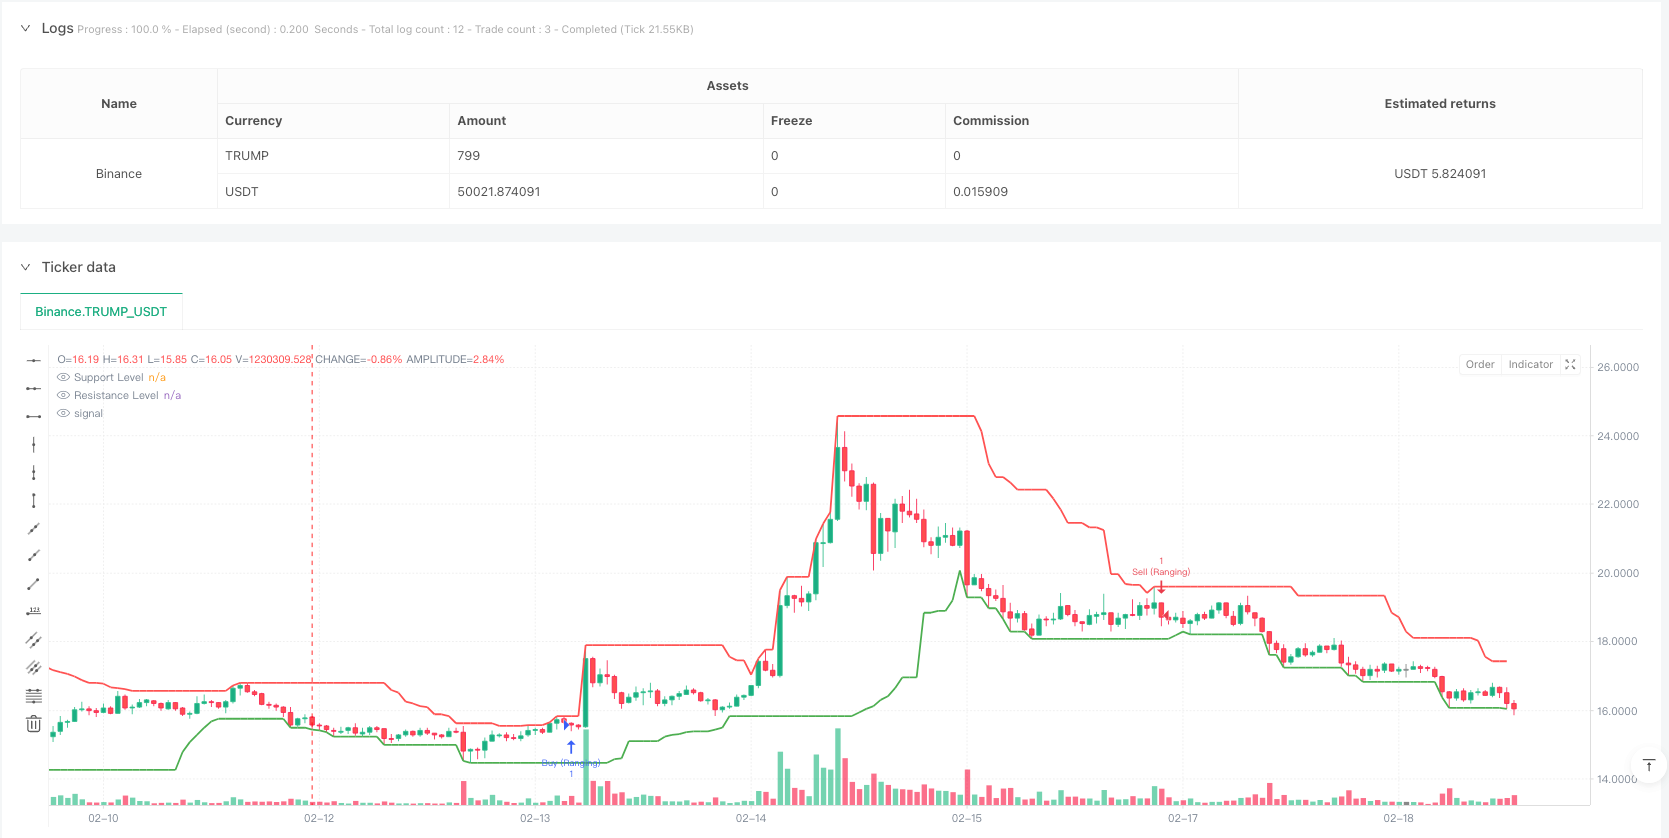
- Identification des zones de résistance de soutien - utilisez les plus hauts et les plus bas des 20 derniers cycles pour déterminer les niveaux de prix critiques
- Confirmation de la forme de l’axe - des formes typiques telles que l’axe de pénétration, l’axe de pénétration, le cordon et la ligne de météorite
- Analyse de la structure du marché - pour déterminer si le marché est en hausse, en baisse ou en zone de fluctuation en comparant une série de hauts et de bas
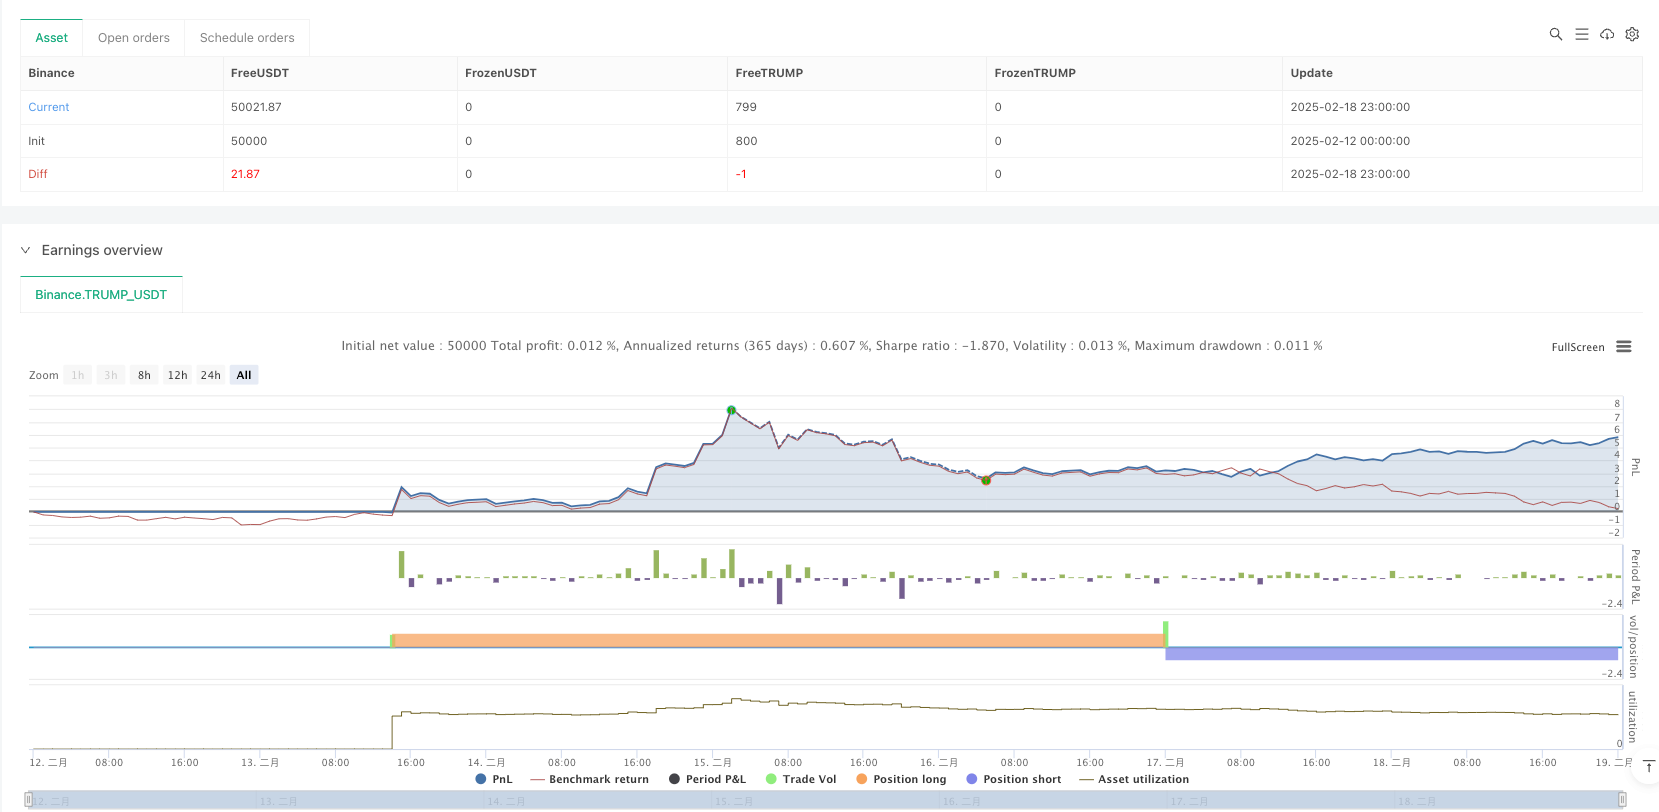
- Gestion des risques - position de stop-loss avec un nombre fixe de points de stop-loss et un rapport risque/bénéfice de 1:3
Les stratégies fonctionnent dans trois types d’environnements de marché: les marchés tendanciels, les marchés intermédiaires et les marchés tournants, mais une combinaison différente de règles de négociation est utilisée pour chaque environnement.
Avantages stratégiques
- Analyse multidimensionnelle - fournit des signaux de négociation plus fiables en intégrant les niveaux de prix, les diagrammes et la structure du marché
- Adaptabilité - capacité à s’adapter à différents environnements de marché, y compris les tendances et les intervalles
- Gestion des risques - utilisation d’un ratio risque/bénéfice fixe pour garantir que chaque transaction est bien maîtrisée
- Soutien visuel - les zones de résistance sont soutenues par des balises graphiques pour aider les traders à comprendre l’état du marché
Risque stratégique
- Risque de fausse rupture - le prix peut se retirer rapidement après une rupture, générant un faux signal
- Risque de glissement - les prix de transaction réels peuvent être plus éloignés des prévisions en période de forte volatilité
- Sensitivité des paramètres - le choix des paramètres qui soutiennent les cycles de résistance, les cycles de structure du marché et autres peut avoir un impact significatif sur la performance de la stratégie
- dépendance aux conditions du marché - risque de mauvaise performance dans des marchés unidirectionnels rapides ou très volatiles
Orientation de l’optimisation de la stratégie
- Ajustement des paramètres dynamiques - Cycle de calcul des zones de résistance de soutien qui s’ajustent automatiquement en fonction des fluctuations du marché
- Amélioration des filtres - ajout d’indicateurs tels que le trafic, le taux de fluctuation pour filtrer les faux signaux de rupture
- Optimisation des arrêts de perte - mise en place de paramètres d’arrêt de perte dynamiques basés sur l’ATR pour une meilleure adaptabilité aux fluctuations du marché
- Vérification des fuseaux horaires - introduction de l’analyse des fuseaux horaires multiples pour améliorer la fiabilité du signal
- Optimisation de la gestion des positions - ajustement dynamique de la taille des positions en fonction de la volatilité du marché et de l’intensité des signaux
Résumer
La stratégie utilise l’intégration de plusieurs outils d’analyse technique pour construire un système de négociation complet. Son avantage réside dans l’analyse multidimensionnelle et la bonne gestion des risques, mais elle est également confrontée à des défis tels que les fausses percées et la sensibilité aux paramètres. Grâce à l’orientation d’optimisation proposée, la stratégie est susceptible d’améliorer encore la stabilité et l’adaptabilité sur la base du maintien des avantages existants.
/*backtest
start: 2025-02-12 00:00:00
end: 2025-02-19 00:00:00
period: 1h
basePeriod: 1h
exchanges: [{"eid":"Binance","currency":"TRUMP_USDT"}]
*/

//@version=5
strategy("Support/Resistance Strategy with Candlestick Confirmation, Market Structure, and 1:3 R:R", overlay=true)

// Input parameters
supportResistancePeriod = input.int(20, title="Support/Resistance Period", minval=1)
stopLossPips = input.int(50, title="Stop Loss (in pips)", minval=1)
takeProfitRatio = input.float(3.0, title="Risk-to-Reward Ratio", minval=1.0)
structurePeriod = input.int(20, title="Market Structure Period", minval=1)  // Period to determine market structure

// Function to calculate support level (lowest low in the period)
getSupportLevel() =>
    ta.lowest(low, supportResistancePeriod)

// Function to calculate resistance level (highest high in the period)
getResistanceLevel() =>
    ta.highest(high, supportResistancePeriod)

// Get the support and resistance levels
supportLevel = getSupportLevel()
resistanceLevel = getResistanceLevel()

// Function to detect market structure
isBullishTrend() =>
    high[structurePeriod] > high[structurePeriod+1] and low[structurePeriod] > low[structurePeriod+1]

isBearishTrend() =>
    high[structurePeriod] < high[structurePeriod+1] and low[structurePeriod] < low[structurePeriod+1]

isRanging() =>
    not isBullishTrend() and not isBearishTrend()

// Candlestick Pattern Detection Functions
isBullishEngulfing() =>
    close[1] < open[1] and close > open and close > open[1] and open < close[1]

isBearishEngulfing() =>
    close[1] > open[1] and close < open and close < open[1] and open > close[1]

isDoji() =>
    math.abs(close - open) <= (high - low) * 0.1

isHammer() =>
    body = math.abs(close - open)
    upperShadow = high - math.max(close, open)
    lowerShadow = math.min(close, open) - low
    body <= (high - low) * 0.3 and lowerShadow > body * 2 and upperShadow <= body * 0.5

isShootingStar() =>
    body = math.abs(close - open)
    upperShadow = high - math.max(close, open)
    lowerShadow = math.min(close, open) - low
    body <= (high - low) * 0.3 and upperShadow > body * 2 and lowerShadow <= body * 0.5

// Conditions for Buy and Sell based on candle close
buyCondition = (isBullishEngulfing() or isHammer()) and close > supportLevel
sellCondition = (isBearishEngulfing() or isShootingStar()) and close < resistanceLevel

// Define buy/sell conditions based on market structure
bullishMarket = isBullishTrend() and buyCondition
bearishMarket = isBearishTrend() and sellCondition
rangingMarket = isRanging() and (buyCondition or sellCondition)

// Calculate the Stop Loss and Take Profit Levels
longStopLoss = supportLevel - (stopLossPips * syminfo.mintick)
shortStopLoss = resistanceLevel + (stopLossPips * syminfo.mintick)

// Calculate R:R based Take Profit Levels
longTakeProfit = close + (math.abs(close - longStopLoss) * takeProfitRatio)
shortTakeProfit = close - (math.abs(close - shortStopLoss) * takeProfitRatio)

// Plotting Support and Resistance Lines
plot(supportLevel, color=color.green, linewidth=2, title="Support Level", style=plot.style_line)
plot(resistanceLevel, color=color.red, linewidth=2, title="Resistance Level", style=plot.style_line)

// Strategy: Buy on Support, Sell on Resistance with candlestick confirmation and market structure
if (bullishMarket)
    strategy.entry("Buy", strategy.long, stop=longStopLoss, limit=longTakeProfit)

if (bearishMarket)
    strategy.entry("Sell", strategy.short, stop=shortStopLoss, limit=shortTakeProfit)

if (rangingMarket)
    if (buyCondition)
        strategy.entry("Buy (Ranging)", strategy.long, stop=longStopLoss, limit=longTakeProfit)
    if (sellCondition)
        strategy.entry("Sell (Ranging)", strategy.short, stop=shortStopLoss, limit=shortTakeProfit)

// Optional: Highlighting the zones for support and resistance
bgcolor(close > resistanceLevel ? color.new(color.red, 90) : na, title="Resistance Zone")
bgcolor(close < supportLevel ? color.new(color.green, 90) : na, title="Support Zone")