
Aperçu
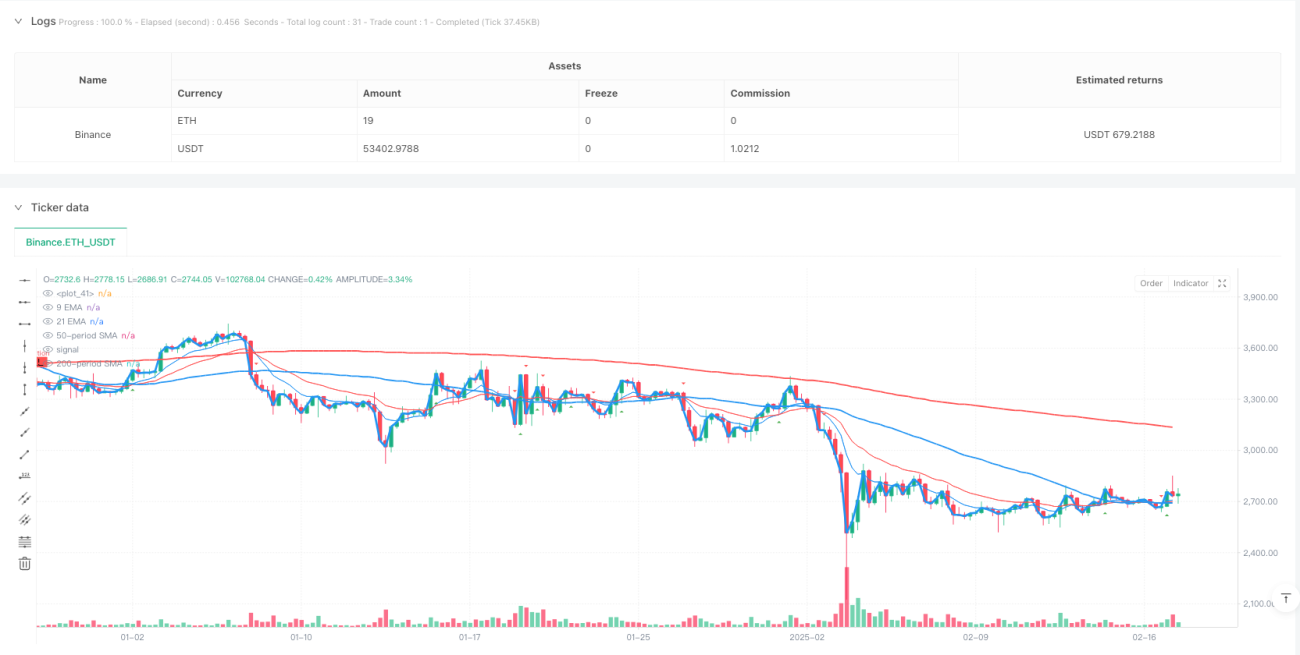
La stratégie est un système de trading de retournement de tendance basé sur une combinaison de plusieurs lignes de moyenne, combinant des moyennes mobiles de 9 cycles, 21 cycles, 50 cycles et 200 cycles, afin de capturer les points de basculement des tendances du marché en identifiant les signaux de croisement de la moyenne. La stratégie intègre les avantages des lignes de moyenne à court et à long terme, capture en temps opportun les changements de dynamique du marché et filtre efficacement les faux signaux.
Principe de stratégie
La logique de base de la stratégie est basée sur un système de croisement homogène de plusieurs périodes de temps:
- Utilisation d'une moyenne mobile simple (SMA) de 50 cycles et de 200 cycles comme indicateur principal de tendance
- Utilisez une moyenne mobile indicielle de 9 cycles et 21 cycles (EMA) comme confirmation de signal à court terme
- Optimiser la qualité du signal en définissant des paramètres de rétroaction (lookback) et de seuil (threshold)
- Identifier les niveaux de prix importants à l'aide d'algorithmes de perspicacité des données, combinés à des jugements de points de support et de résistance clés
Lorsque la moyenne à court terme traverse la moyenne à long terme vers le haut, le système émet un signal de multiplication; à l'inverse, un signal de rupture.
Avantages stratégiques
- Fiabilité du système de signaux: réduction significative du risque de faux signaux grâce à la confirmation croisée de multiples lignes moyennes
- Prise de tendance en temps opportun: l'introduction de la courbe moyenne à court terme permet à la stratégie de réagir rapidement aux changements du marché
- La globalité des contrôles de risque: l'identification des points de support et de résistance aide à définir rationnellement la position d'arrêt de perte
- Flexibilité d'optimisation des paramètres: les périodes de rétrocession et les paramètres de dépréciation peuvent être ajustés en fonction des différentes conditions du marché
- L'intuition des effets visuels: le système fournit une interface graphique claire pour faciliter les décisions de transaction
Risque stratégique
- Risque de choc: les faux signaux peuvent être fréquents pendant la phase de liquidation
- Risque de retard: les moyennes mobiles sont essentiellement un indicateur de retard qui peut manquer le meilleur moment d'entrée
- Sensibilité des paramètres : différentes combinaisons de paramètres peuvent entraîner de grandes différences dans les performances de la stratégie
- Dépendance aux conditions du marché: la stratégie est plus performante dans les marchés où la tendance est évidente et peut être moins performante dans les périodes de forte volatilité
Orientation de l'optimisation de la stratégie
- Introduction d'indicateurs de quantité d'énergie: considérer le volume d'échange comme un indicateur auxiliaire de la confirmation du signal
- Optimisation du filtrage du signal: conception de mécanismes de confirmation du signal plus stricts, tels que la nécessité d'un signal de durée déterminée
- Ajustement dynamique des paramètres: développement d'un système de paramètres adaptatifs qui ajuste automatiquement les paramètres en fonction des conditions du marché
- Améliorer la maîtrise des risques: augmenter le stop-loss dynamique et protéger les profits déjà réalisés
- Admission au jugement du marché: en combinant les indicateurs de volatilité avec des paramètres différents dans différents environnements de marché
Résumer
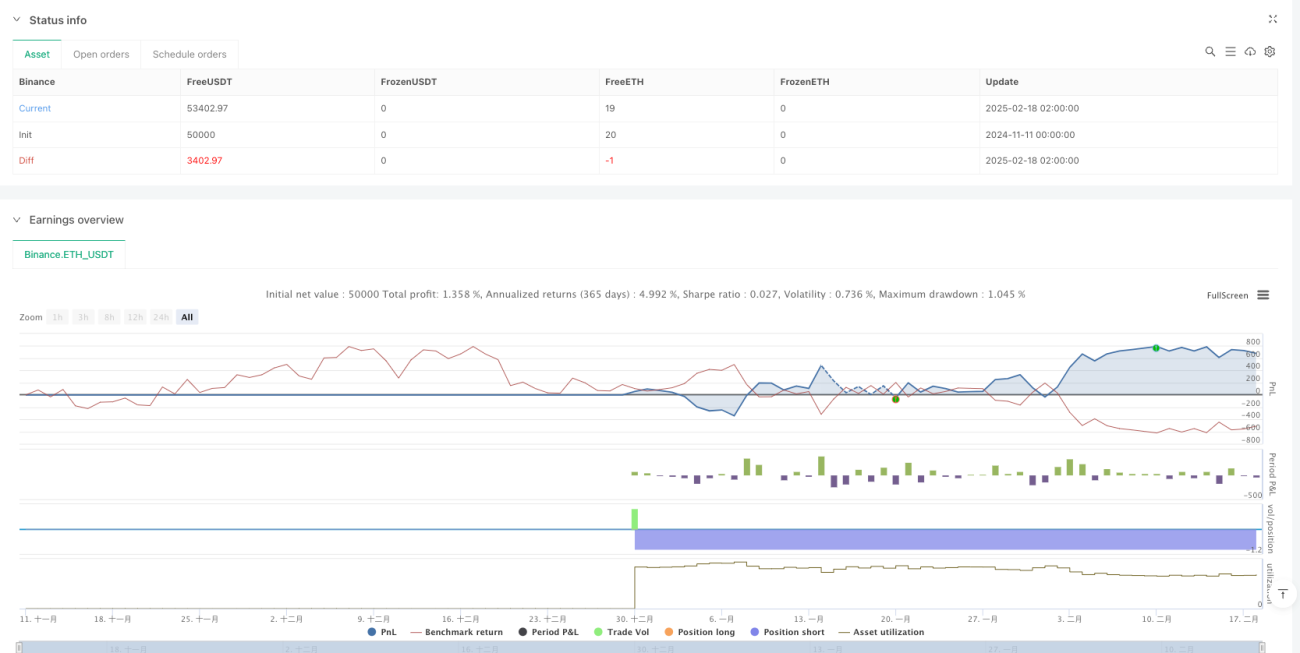
La stratégie permet d'identifier efficacement les points d'inflexion des tendances du marché grâce à la synergie de plusieurs systèmes de linéaires égaux. La stratégie est conçue en mettant l'accent sur la praticité et l'opérabilité, et peut s'adapter à différents environnements de marché grâce à un ajustement flexible des paramètres. Bien qu'il existe certaines limites, la performance globale de la stratégie a un bon potentiel de développement grâce à une optimisation et à une amélioration continues.
- 1