Stratégie de suivi des tendances sur plusieurs périodes et de confirmation des volumes

Aperçu
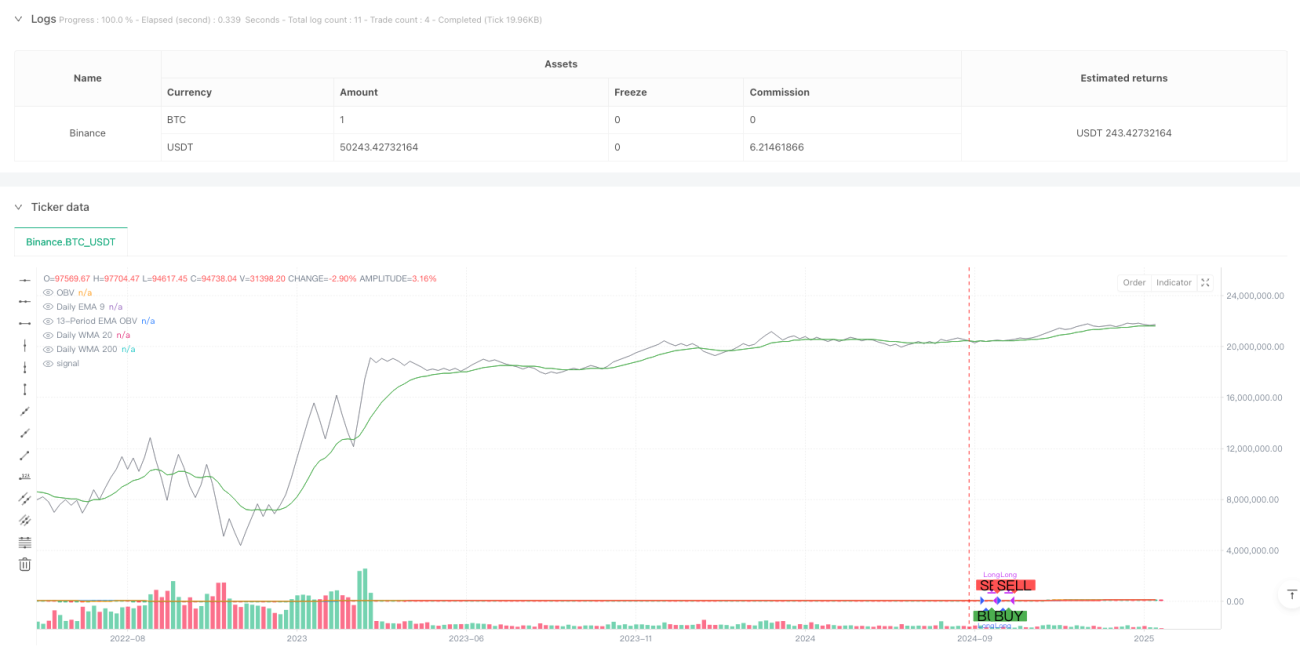
La stratégie est un système de suivi de la tendance combinant des moyennes mobiles multi-périodes et une analyse du volume des transactions. La stratégie confirme la tendance globale à l'aide des trois moyennes EMA9, WMA20 et WMA200 des cycles de la ligne solaire, tout en introduisant l'indicateur OBV (On Balance Volume) et son EMA pour la confirmation du volume des transactions, permettant des transactions de suivi de tendance plus robustes.
Principe de stratégie
La stratégie est basée sur deux conditions fondamentales:
- Confirmation de la tendance - Confirmation de la direction de la tendance en jugeant si les trois courbes de la journée (EMA9, WMA20, WMA200) sont en hausse. Lorsque les trois courbes de la journée sont inclinées vers le haut, cela indique que chaque période de temps présente une tendance à plusieurs têtes.
- Confirmation de la quantité de transaction - analyse de la quantité de transaction avec l'indicateur OBV et son EMA à 13 cycles. Lorsque l'EMA de l'OBV est supérieure à l'OBV, cela indique que la quantité de transaction soutient la hausse des prix et confirme l'efficacité de la tendance.
La stratégie ne génère un signal de multiplication que si les deux conditions sont remplies simultanément. Si l'une ou l'autre condition n'est pas remplie, la stratégie s'arrête.
Avantages stratégiques
- Analyse de plusieurs périodes - réduire le risque de fausse rupture en tenant compte intégralement des tendances à court terme (EMA9), à moyen terme (WMA20) et à long terme (WMA200)
- Le support de la quantité de transaction - introduit l'analyse des indicateurs OBV pour s'assurer que la tendance des prix est soutenue par la combinaison de la quantité de transaction.
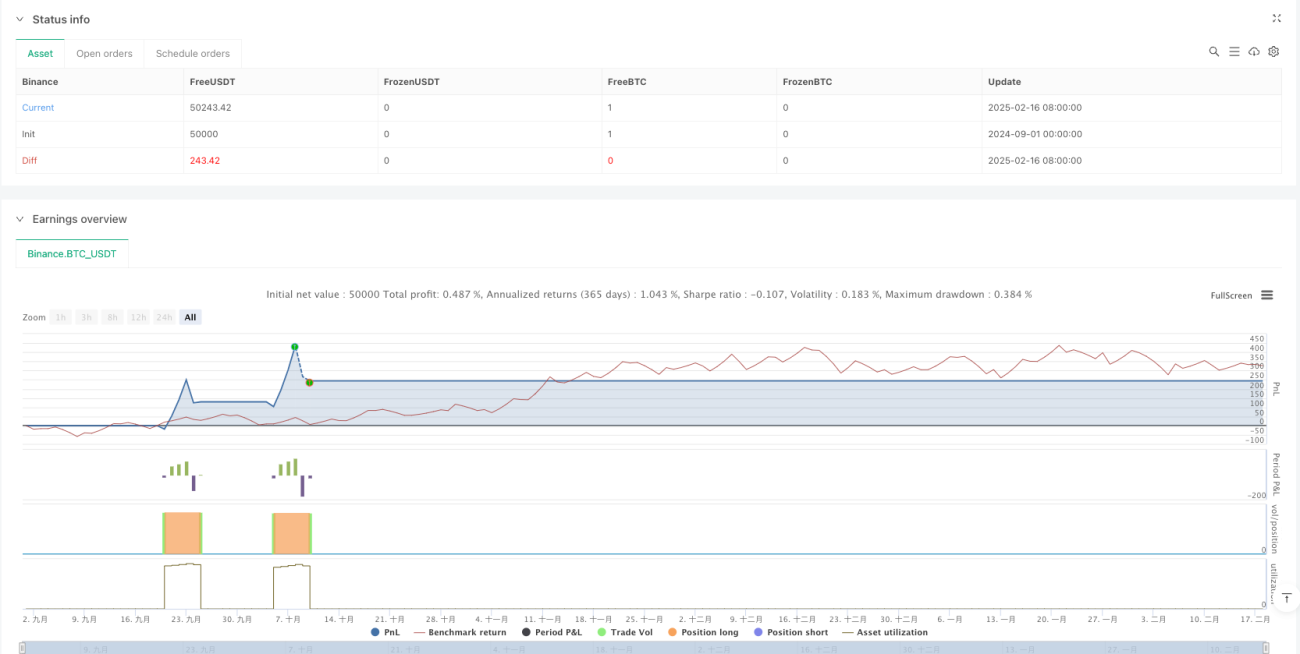
- Le contrôle des risques est parfait - la gestion des positions en pourcentage et les commissions sont prises en compte, ce qui correspond mieux à l'environnement de négociation réel.
- Aide visuelle - aide les traders à comprendre les heures d'entrée et de sortie grâce à des marquages graphiques clairs.
Risque stratégique
- Retard dans le renversement de tendance - la réaction peut être plus lente au début du renversement de tendance en raison de l'utilisation de plusieurs confirmations de ligne moyenne.
- Les marchés de choc ne s'appliquent pas - les fausses ruptures fréquentes peuvent entraîner des transactions excessives pendant la phase de liquidation horizontale.
- Le coût du capital est pris en compte - des frais de 0.1% peuvent avoir un impact significatif sur les bénéfices dans les transactions à haute fréquence.
Orientation de l'optimisation de la stratégie
- L'introduction d'indicateurs de volatilité - l'ajout d'indicateurs de volatilité tels que l'ATR peut être envisagé pour ajuster dynamiquement les positions dans différentes conditions de marché.
- Amélioration des mécanismes d'arrêt des pertes - Il est recommandé d'ajouter une fonction de suivi des pertes pour mieux protéger les bénéfices.
- Filtre d'environnement de marché - peut ajouter des indicateurs de jugement d'environnement de marché, réduire la fréquence des transactions ou suspendre les transactions dans les marchés en crise.
- Optimisation des paramètres - Optimisation des cycles de moyenne ligne et des paramètres OBV pour différents marchés et variétés.
Résumer
La stratégie, combinant l'analyse de tendances à plusieurs cycles et la confirmation des volumes de transactions, construit un système de suivi des tendances relativement complet. La logique de la stratégie est claire, le contrôle des risques est raisonnable, mais il reste de la place pour l'optimisation. Il est recommandé aux traders de tester soigneusement dans le marché réel et d'ajuster les paramètres en fonction des caractéristiques spécifiques du marché.
/*backtest
start: 2024-09-01 00:00:00
end: 2025-02-18 08:00:00
period: 5d
basePeriod: 5d
exchanges: [{"eid":"Binance","currency":"BTC_USDT"}]
*/

//@version=6
strategy("Strategy: Daily MAs + OBV", overlay=true, initial_capital=10000, default_qty_type=strategy.percent_of_equity, default_qty_value=10, commission_type=strategy.commission.percent, commission_value=0.1)

//=== Daily Moving Averages Calculation =========================- 1