Stratégie de croisement multi-indicateurs adaptative dynamique combinée au système de contrôle intelligent des risques SRSI et MACD

Aperçu
La stratégie est un système de trading dynamique qui combine un indicateur aléatoire relativement faible (SRSI) et un indicateur mobile de tendance/diffusion (MACD). Il permet une gestion intelligente du risque en ajustant dynamiquement les points d'arrêt et d'arrêt avec l'indicateur ATR. Le cœur de la stratégie est de générer des signaux de trading par la confirmation croisée de plusieurs indicateurs techniques, tout en gérant les positions en fonction de la volatilité du marché.
Principe de stratégie
Le fonctionnement de la stratégie repose sur les mécanismes centraux suivants:
- Calculer la différence entre la ligne K et la ligne D dans l'indicateur SRSI et la différence entre la ligne K et le MACD normalisé pour déterminer la tendance du marché
- Les conditions d'achat doivent être remplies simultanément: différence K-D est positive, différence K-MACD est positive et le MACD n'est pas en baisse
- Les conditions de vente doivent être remplies simultanément: la différence K-D est négative, la différence K-MACD est négative et le MACD n'est pas en hausse
- Utilisez l'ATR multiplié par le coefficient de risque pour calculer dynamiquement les arrêts de perte et les arrêts de rupture, en s'adaptant à la volatilité du marché
Avantages stratégiques
- Les mécanismes de confirmation de signaux multiples améliorent considérablement la fiabilité des transactions et évitent les faux signaux qu'un seul indicateur pourrait entraîner.
- Les paramètres de stop-loss dynamiques permettent de s'adapter automatiquement aux fluctuations du marché, offrant un meilleur rapport risque/bénéfice.
- La stratégie est bien adaptée et peut maintenir une performance stable dans différents environnements de marché
- Les paramètres sont réglables et permettent aux traders d'optimiser en fonction de leurs préférences personnelles en matière de risque
Risque stratégique
- Les signaux de transaction peuvent être excessifs dans un marché en crise, entraînant des entrées et des sorties fréquentes.
- L'utilisation de multiples indicateurs peut entraîner un retard de signal et la perte d'une opportunité d'entrée optimale dans un marché en évolution rapide
- L'ATR est basé sur la volatilité historique et peut ne pas être adapté en temps opportun aux fluctuations du marché.
- Il est nécessaire de définir un coefficient de risque raisonnable, trop grand ou trop petit peut nuire à l'efficacité de la stratégie
Orientation de l'optimisation de la stratégie
- Ajout d'un filtre de tendance, différents critères de reconnaissance des signaux dans les marchés oscillants et les marchés tendance
- Introduction d'indicateurs de débit comme confirmation auxiliaire pour améliorer la fiabilité du signal
- La méthode de calcul de l'optimisation de l'arrêt de perte de frein peut être envisagée en combinaison avec le point de résistance de support
- Ajout de modèles de prévision de la volatilité du marché et ajustement anticipé des paramètres de risque
- Considérer la confirmation des signaux sur différentes périodes de temps pour augmenter la robustesse de la stratégie
Résumer
La stratégie construit un système de négociation robuste en combinant les avantages du SRSI et du MACD. Le mécanisme de gestion dynamique des risques le rend bien adapté, mais nécessite toujours l'optimisation des paramètres par le trader en fonction des conditions réelles du marché. Le fonctionnement réussi de la stratégie nécessite une compréhension approfondie du marché et une gestion rationnelle des positions combinée à la tolérance au risque de l'individu.
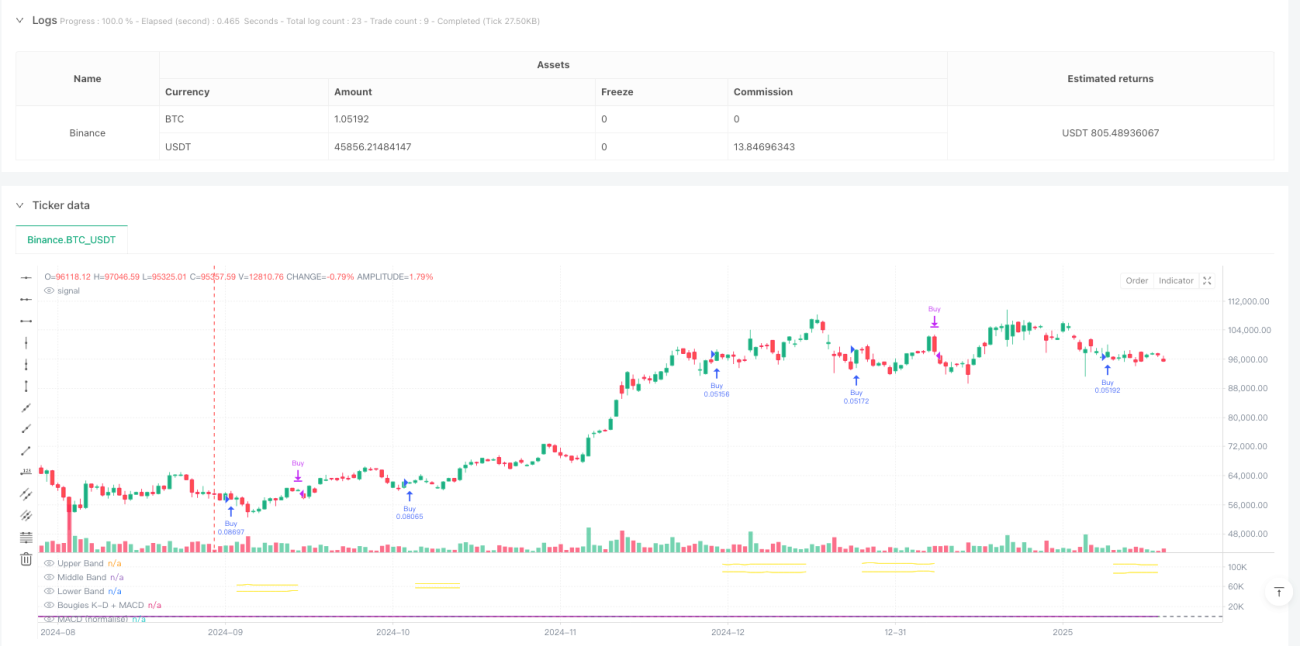
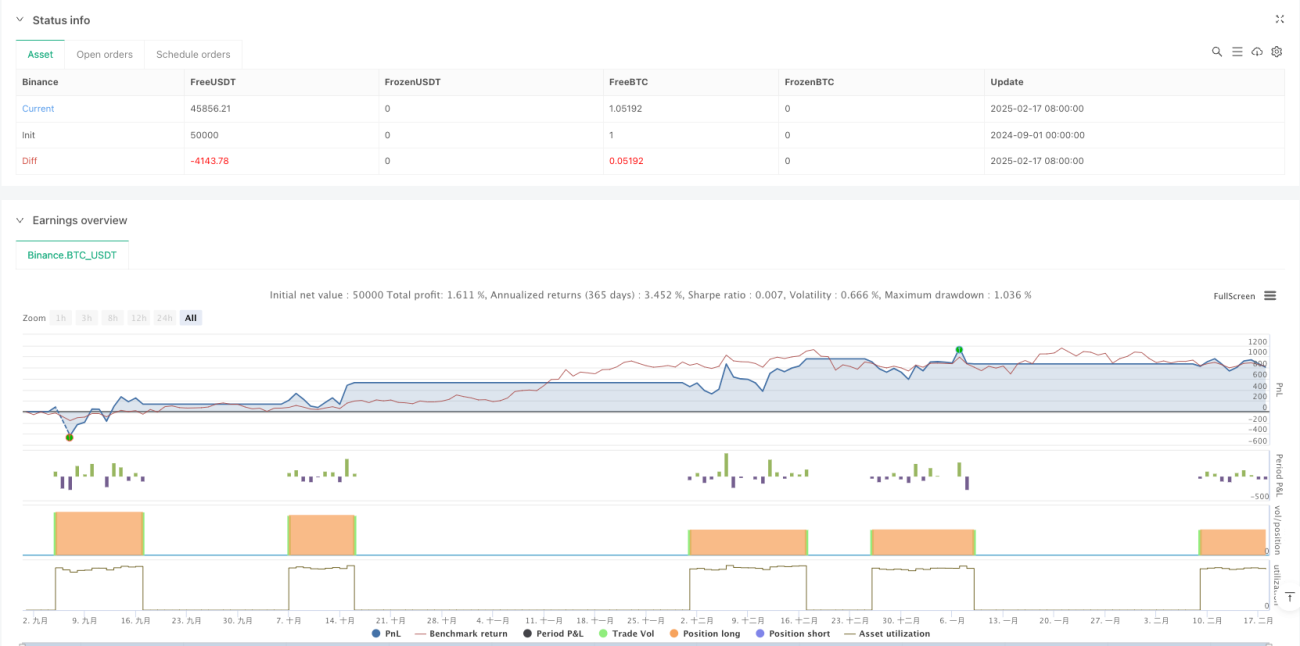
/*backtest
start: 2024-09-01 00:00:00
end: 2025-02-18 08:00:00
period: 1d
basePeriod: 1d
exchanges: [{"eid":"Binance","currency":"BTC_USDT"}]
*/

//@version=6
strategy(title="SRSI + MACD Strategy with Dynamic Stop-Loss and Take-Profit", shorttitle="SRSI + MACD Strategy", overlay=false, default_qty_type=strategy.percent_of_equity, default_qty_value=10)

// User Inputs- 1