
Aperçu
Cette stratégie est un système de trading qui combine le suivi de la tendance et le renversement de la dynamique. Elle est principalement basée sur la moyenne de l'EMA de 34 cycles pour juger de la tendance globale, en identifiant les zones de survente et de survente à l'aide de l'indicateur RSI, tout en combinant la forme de la ligne K et le signal de confirmation de transaction.
Principe de stratégie
La logique fondamentale de la stratégie comprend les éléments clés suivants :
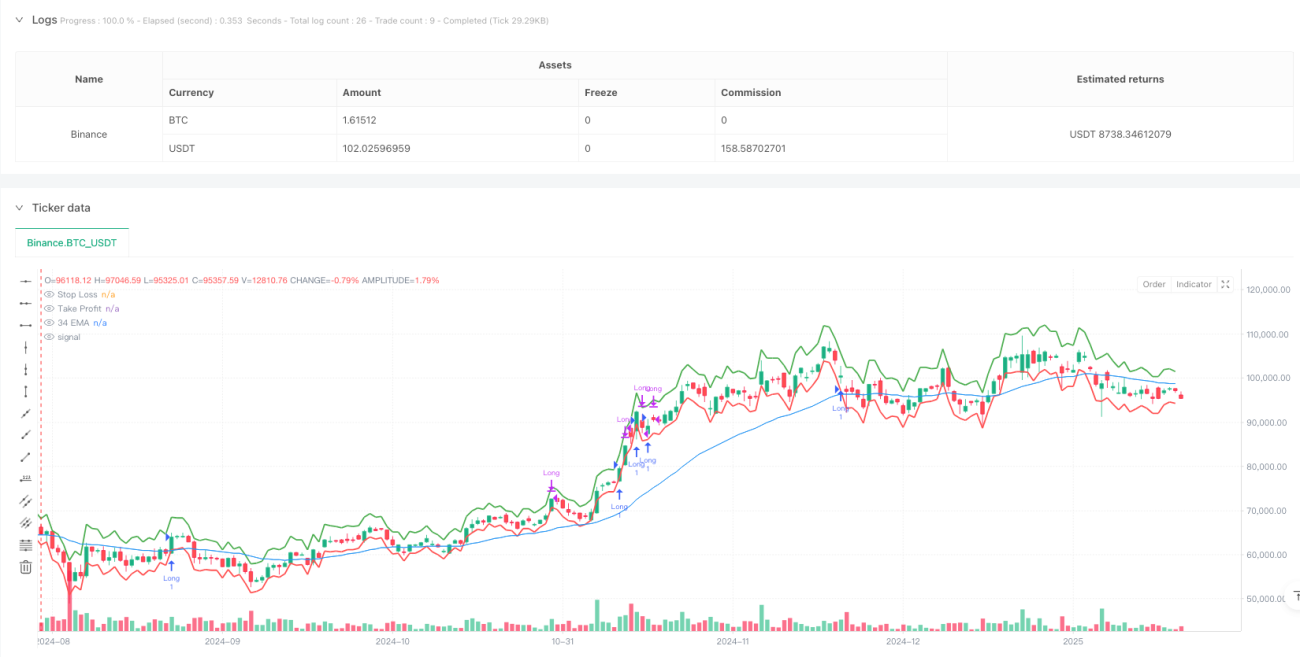
- Juge de tendance: utilisez l'EMA à 34 cycles comme principal indicateur de tendance et ne cherchez des opportunités de trading que lorsque le prix est au-dessus de l'EMA
- Conditions d'entrée: nécessité d'une combinaison de lignes K "Yin-Yang-Yang" en série, c'est-à-dire une ligne yin suivie de deux lignes yang
- Confirmation de la dynamique: utilisation de l'indicateur RSI pour la confirmation de la dynamique, qui nécessite une valeur RSI supérieure à 50 pour indiquer une énergie d'oscillation vers le haut
- Filtre de transaction: Le volume de transaction actuel doit être supérieur à la moyenne des transactions sur 20 cycles pour assurer une participation suffisante sur le marché
- Gestion des risques: utilisez 1,5 fois l'ATR comme objectif de profit et 1 fois l'ATR comme position de stop-loss
Avantages stratégiques
- Confirmation de plusieurs signaux: la confirmation de transactions combinant plusieurs dimensions de tendance, de forme, de dynamique et de transaction peut réduire efficacement les faux signaux
- Gestion dynamique des risques: paramètres stop-loss et gain basés sur l'ATR, qui peuvent être automatiquement ajustés en fonction de la volatilité du marché
- Caractéristique de suivi des tendances: les EMA permettent d'assurer la négociation dans le sens des tendances dominantes et d'améliorer les chances de succès
- Configuration de paramètres flexible: les paramètres clés tels que les cycles EMA, les valeurs minimales du RSI et les multiples ATR peuvent être ajustés pour s'adapter à différents environnements de marché
Risque stratégique
- Risque de renversement de tendance: pertes continues à un point de basculement
- Risque de fausse rupture: la forme de la ligne K peut entraîner une fausse rupture, entraînant un faux signal
- Risque de fluctuation du marché: les valeurs d'ATR peuvent être anormalement élevées pendant les périodes de forte volatilité, ce qui affecte les paramètres de stop loss
- Sensitivité des paramètres: les paramètres optimaux peuvent varier considérablement selon les environnements de marché
Orientation de l'optimisation de la stratégie
- Ajout d'un filtre de force de tendance: l'indicateur ADX peut être introduit pour mesurer la force de la tendance et ne négocier que dans une tendance forte
- Amélioration du mécanisme de sortie: la possibilité d'ajouter un stop mobile pour protéger les gains
- Optimiser les indicateurs de chiffre d'affaires: envisager l'utilisation d'indicateurs de chiffre d'affaires relatifs ou de chiffre d'affaires de rupture
- Augmentation du filtrage temporel: ajout de fenêtres de temps de négociation pour éviter les périodes de plus grande volatilité
- Introduction de la classification des environnements de marché: paramètres de stratégie adaptés en fonction des différentes dynamiques du marché
Résumer
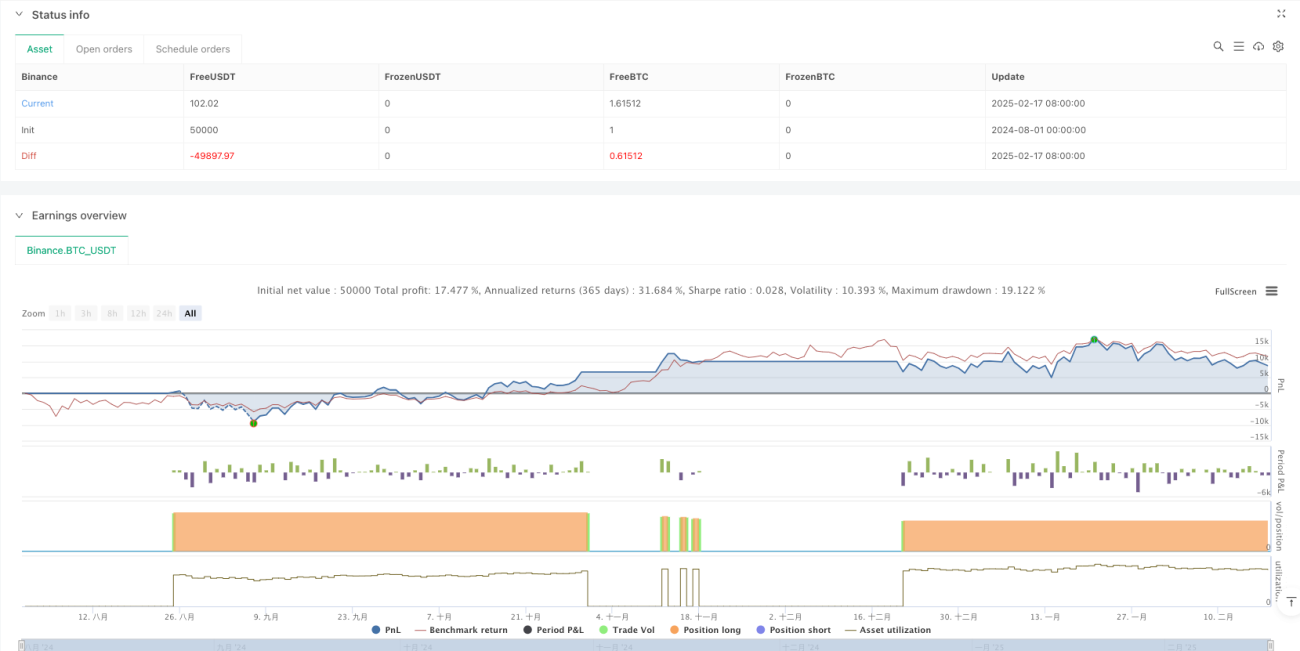
La stratégie est construite en combinant plusieurs indicateurs techniques pour construire un système de négociation complet, avec une bonne adaptabilité et une évolutivité. Les avantages centraux de la stratégie résident dans la confirmation de signaux multidimensionnels et la gestion dynamique des risques, mais il faut également prêter attention à l'optimisation des paramètres et à l'adaptation aux conditions du marché.
- 1