Stratégie de trading à double indicateur SuperTrend-Stochastic améliorée par Momentum

Aperçu
Il s'agit d'une stratégie de négociation composite qui combine un indicateur de tendance supérieure (SuperTrend) et un indicateur d'oscillation aléatoire (Stochastic Oscillator). Cette stratégie utilise l'indicateur de tendance supérieure (SuperTrend) pour identifier la direction de la tendance du marché, tout en utilisant l'indicateur d'oscillation aléatoire pour confirmer la dynamique des prix, ce qui permet une génération de signal de négociation plus précise.
Principe de stratégie
La logique centrale de la stratégie est basée sur les éléments clés suivants:
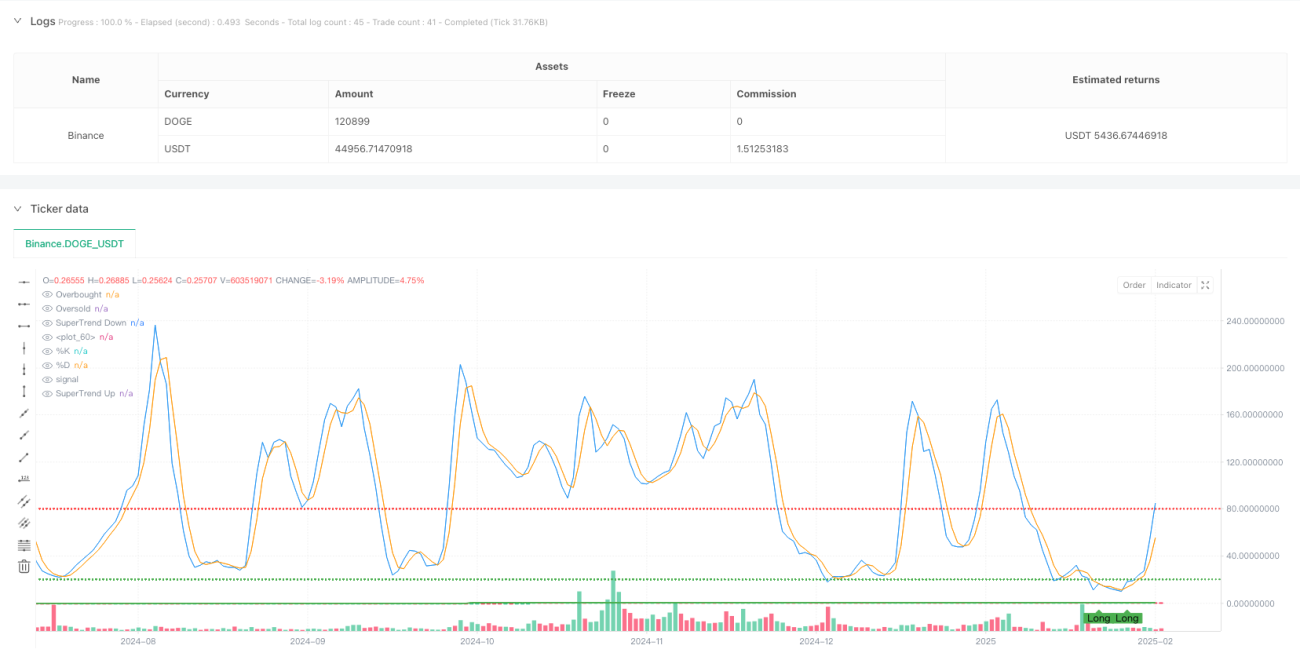
- L'indicateur de SuperTrend utilise un ATR de 10 cycles et un multiplicateur de 3,0 pour calculer le canal de résistance au support dynamique
- L'indicateur de choc aléatoire utilise un paramètre classique ({14,3,3}) pour identifier les zones de survente.
- Les conditions sont multiples:
- Le SuperTrend indique une tendance haussière
- Indicateur aléatoire %K sur la ligne %D
- % K situé dans la zone de survente (< 20)
- Conditions de mise à l'air
- Le SuperTrend indique une tendance à la baisse
- Indicateur aléatoire %K traversant la ligne %D
- %K est dans la zone de survente (< 80)
Avantages stratégiques
- Le suivi des tendances et la confirmation de la dynamique, combinés, améliorent considérablement la fiabilité des signaux de négociation
- Adaptation dynamique de la largeur du canal SuperTrend à l'aide de l'ATR pour mieux s'adapter aux fluctuations du marché
- Filtrez les surachats sur les indices aléatoires afin d'éviter les opérations sur le contre-pied dans les zones extrêmes
- Les conditions de signal sont strictes, ce qui permet de filtrer efficacement les fausses interférences et de réduire les faux signaux.
- Une logique stratégique claire et des paramètres adaptables pour différents environnements de marché
Risque stratégique
- Les signaux de survente peuvent augmenter les coûts de transaction dans un marché en crise
- Les conditions de signaux sont trop strictes et peuvent laisser passer des opportunités de trading potentielles.
- L'indicateur de SuperTrend peut être retardé lors de fortes fluctuations
- L'indicateur aléatoire pourrait donner un signal de revers prématuré dans un marché en forte tendance
Les mesures de contrôle des risques suivantes sont recommandées:
- Régler le stop loss à une position raisonnable
- Considérez d'ajouter un filtre de force de tendance (comme l'ADX)
- Paramètres d'ajustement en fonction de l'évolution du marché
Orientation de l'optimisation de la stratégie
- Introduction de filtres de négociation optimisés pour les indicateurs de force de tendance (comme l'ADX):
- N'ouvrez une position que lorsque la tendance est claire
- Des transactions fréquentes peuvent éviter des bouleversements
- Optimiser les paramètres des indicateurs aléatoires:
- Pensez à un cycle d'adaptation
- Ajuster la dynamique de la volatilité de la marge de dépassement
- Pour améliorer le système de gestion des fonds:
- Position d'arrêt dynamique basée sur ATR
- Dynamique d'ajustement pour atteindre les objectifs de profit
- Ajouter un filtrage temporel:
- Évitez les périodes de faible liquidité
- Suspension des transactions avant la publication des données importantes
Résumer
La stratégie est conçue de manière rationnelle et présente une bonne ajustabilité et adaptabilité. La stabilité et la rentabilité de la stratégie sont susceptibles d'être encore améliorées grâce à l'optimisation de la direction recommandée. Dans les transactions en direct, il est recommandé aux traders d'ajuster les paramètres de manière ciblée en fonction des caractéristiques spécifiques du marché et de leurs propres préférences en matière de risque.
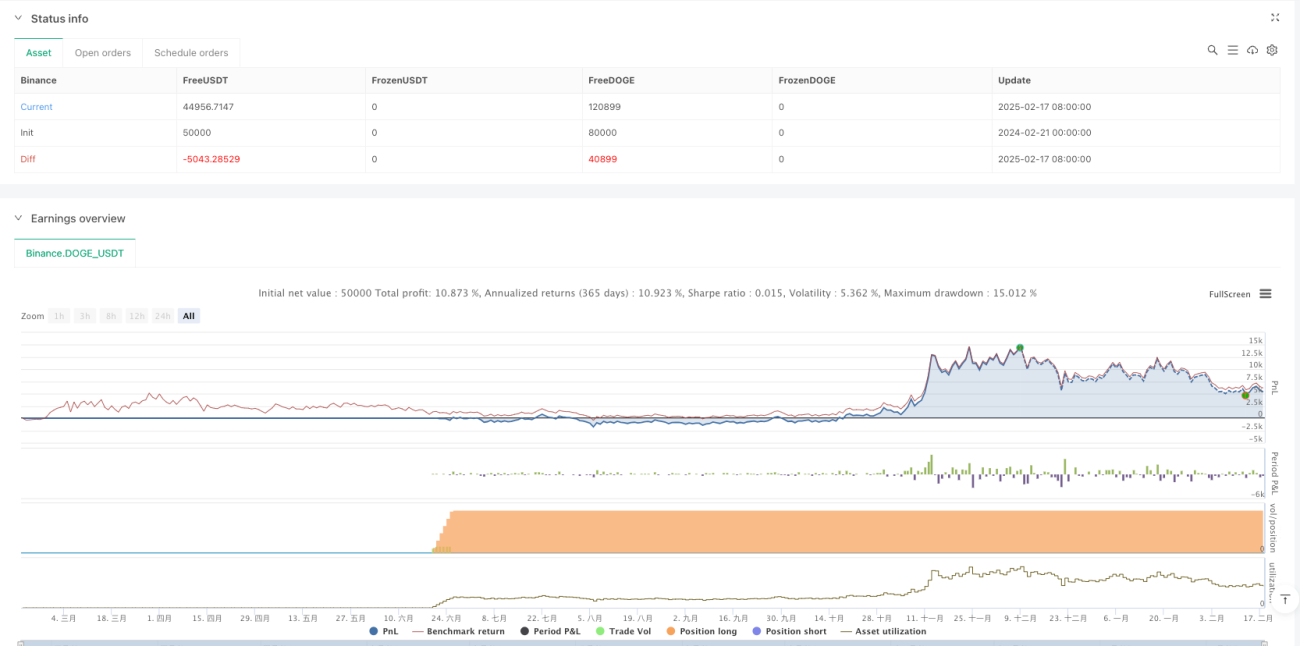
/*backtest
start: 2024-02-21 00:00:00
end: 2025-02-18 08:00:00
period: 1d
basePeriod: 1d
exchanges: [{"eid":"Binance","currency":"DOGE_USDT"}]
*/

//@version=5
strategy("SuperTrend + Stochastic Strategy", overlay=true, default_qty_type=strategy.percent_of_equity, default_qty_value=10)

// === Vstupy ===- 1