
Aperçu
La stratégie est un système de négociation qui combine un signal de croisement bi-homogène et une gestion dynamique du risque. Elle génère des signaux de négociation par la croisée des moyennes mobiles à court et à long terme, tout en utilisant l'indicateur ATR pour ajuster dynamiquement les arrêts et les gains, et en introduisant des filtres de temps et des périodes de refroidissement pour optimiser la qualité des transactions.
Principe de stratégie
La stratégie repose sur les éléments fondamentaux suivants :
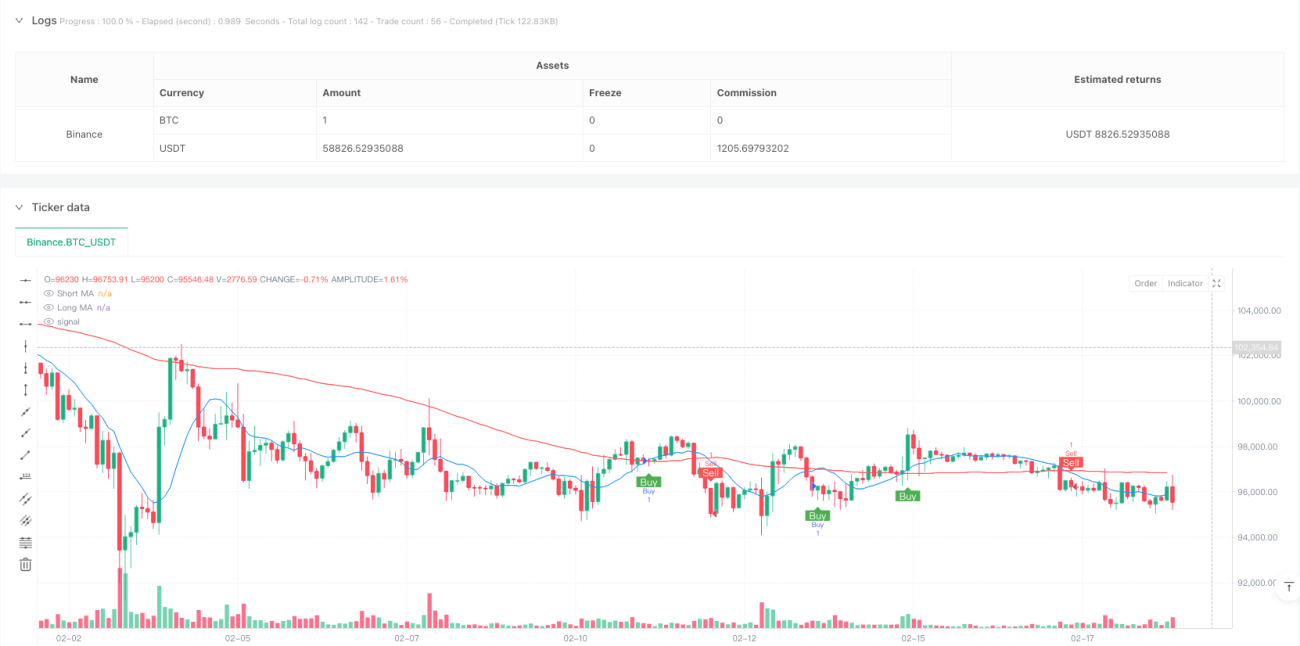
- Le système de génération de signaux utilise la croisée des moyennes mobiles simples à court terme (en 10 cycles) et à long terme (en 100 cycles) pour déclencher la transaction. Un signal de plus est généré lorsque la moyenne à court terme traverse la moyenne à long terme vers le haut, et un signal de moins lorsque la moyenne à court terme traverse la moyenne à long terme vers le haut.
- Le système de gestion des risques utilise l'ATR à 14 cycles multiplié par un facteur de 1,5 pour définir une distance de stop-loss dynamique et un objectif de profit de 2 fois la distance de stop-loss (ratio de risque/bénéfice réglable).
- Le filtre temporel permet à l'utilisateur de définir une période de temps spécifique pour la transaction et d'effectuer la transaction uniquement dans la période spécifiée.
- Le mécanisme de refroidissement de la transaction a été mis en place avec une période d'attente de 10 cycles pour prévenir les transactions excessives.
- Le risque de chaque transaction est contrôlé à 1% du compte.
Avantages stratégiques
- Gestion dynamique des risques: l'indicateur ATR est utilisé pour s'adapter à la volatilité du marché et pour ajuster automatiquement les marges stop-loss et gain dans différents environnements.
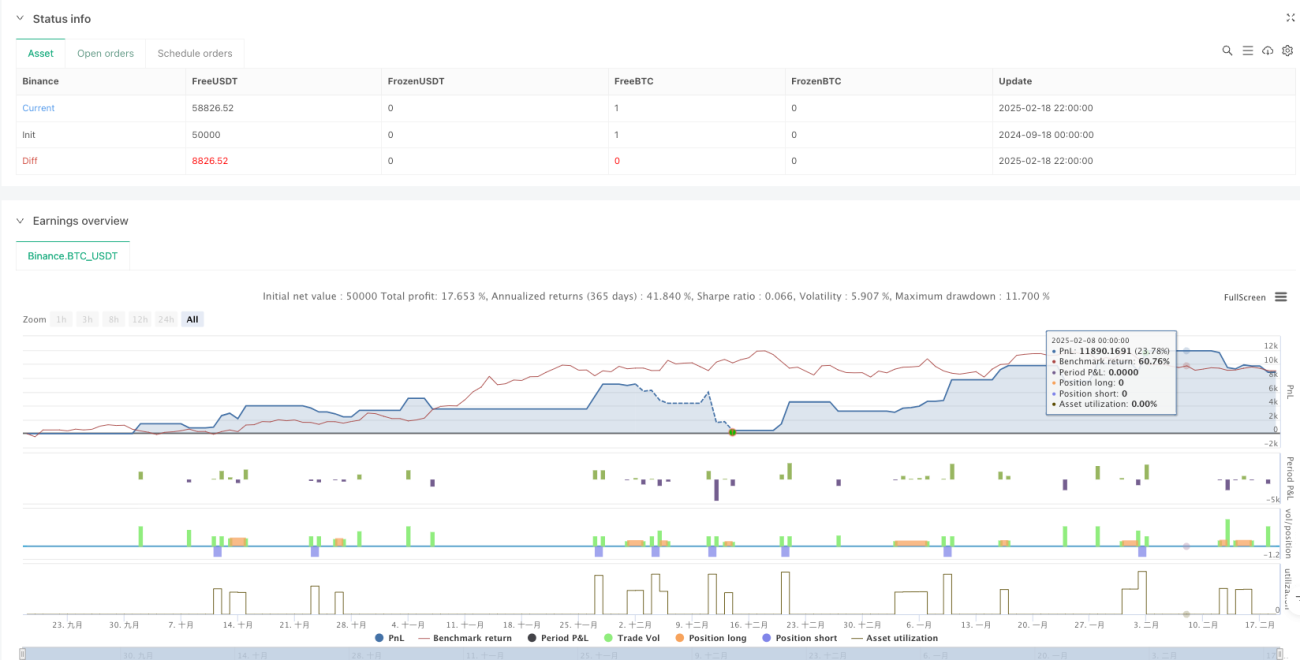
- Gestion complète des risques: Gestion systématique des fonds en définissant le rapport entre le risque et le rendement et le ratio de risque par transaction.
- Gestion flexible des heures: les heures de négociation peuvent être ajustées en fonction des caractéristiques de la période de négociation des différents marchés.
- Prévention des transactions excessives: le mécanisme de la période de refroidissement est efficace pour éviter de générer des signaux de transactions excessifs en période de forte volatilité.
- Effets visuels: affichage clair des signaux de négociation et des moyennes mobiles sur un graphique pour faciliter l'analyse et l'optimisation.
Risque stratégique
- Risque de renversement de tendance: il peut y avoir de faux signaux de rupture dans un marché instable, entraînant des pertes continues.
- Sensitivité des paramètres: le choix de paramètres tels que la périodicité des moyennes mobiles, le multiplicateur ATR, etc. peut avoir un impact significatif sur la performance de la stratégie.
- Un mauvais réglage du filtre temporel peut vous faire rater des opportunités commerciales importantes.
- Le rapport risque/bénéfice fixe peut ne pas être suffisamment flexible dans différents environnements de marché.
Orientation de l'optimisation de la stratégie
- Introduction d'un filtre de force de tendance: ADX ou des indicateurs similaires peuvent être ajoutés pour juger de la force de la tendance, en négociant uniquement pendant une forte tendance.
- Le ratio risque/revenu ajusté dynamiquement: Le ratio risque/revenu ajusté automatiquement en fonction de la volatilité du marché ou de l'intensité de la tendance.
- Augmentation de l'analyse du volume des transactions: le volume des transactions est utilisé comme indicateur supplémentaire de la confirmation du signal.
- Optimisation du mécanisme de la période de refroidissement: la durée de la période de refroidissement est adaptée à la dynamique de la volatilité du marché.
- Ajouter une classification des environnements de marché: différentes combinaisons de paramètres sont utilisées dans différents environnements de marché.
Résumer
La stratégie construit un système de négociation complet en combinant des méthodes d'analyse technique classiques et des concepts modernes de gestion des risques. Ses principaux avantages résident dans la gestion dynamique des risques et les mécanismes de filtrage multiples, mais il reste nécessaire d'optimiser les paramètres en fonction des caractéristiques spécifiques du marché dans les applications pratiques. Le bon fonctionnement de la stratégie nécessite une compréhension approfondie du rôle de chaque composant par le trader et un ajustement en temps opportun des paramètres en fonction des changements du marché.
/*backtest
start: 2024-09-18 00:00:00
end: 2025-02-19 00:00:00
period: 2h
basePeriod: 2h
exchanges: [{"eid":"Binance","currency":"BTC_USDT"}]
*/

//@version=5
strategy("Profitable Moving Average Crossover Strategy", shorttitle="Profitable MA Crossover", overlay=true)

// Input parameters for the moving averages- 1