
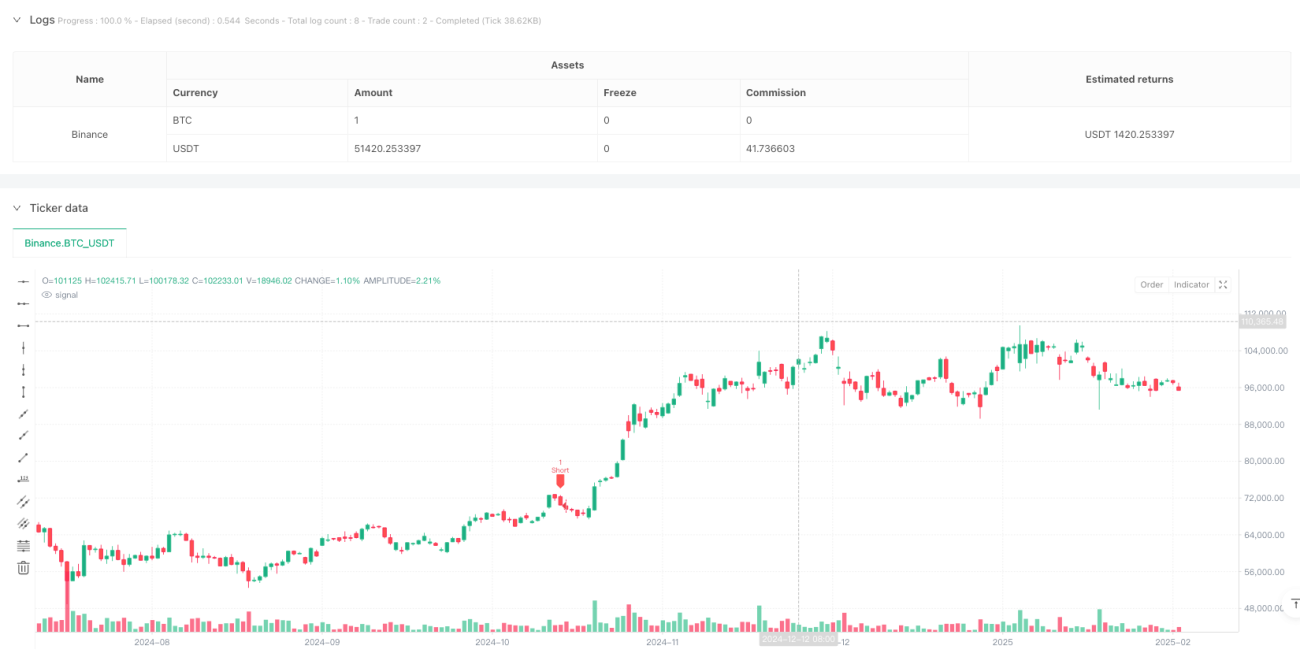
Aperçu
Cette stratégie est un système de trading en bandes de fréquence multi-cadres basé sur un indicateur stochastique. Elle identifie les opportunités de trading en combinant des signaux d'indicateurs aléatoires du cadre temporel actuel et des cadres temporels supérieurs, et utilise un stop-loss dynamique pour gérer le risque.
Principe de stratégie
La logique fondamentale de la stratégie repose sur les éléments clés suivants :
- Confirmation du signal à l'aide d'indicateurs aléatoires sur deux périodes (actuelle et plus avancée)
- Recherche de signaux de croisement dans les zones de survente
- Conditions d'achat: ligne D sur la ligne K de la période actuelle et une valeur de K < 20; une valeur de K supérieure à 20 et une valeur de K > D
- Conditions de vente: la ligne D est traversée par la ligne K de la période actuelle et la valeur de K est supérieure à 80; la ligne D est traversée par la ligne K de la période actuelle et la valeur de K est supérieure à 80 et la valeur de K est inférieure à D
- Système de stop-loss dynamique basé sur le prix d'entrée, avec un multiplicateur de stop-loss réglable
Avantages stratégiques
- La confirmation de signaux multi-cadres améliore la fiabilité des transactions et réduit efficacement les signaux faux
- Les transactions dans les zones de survente augmentent la probabilité d'un renversement de tendance
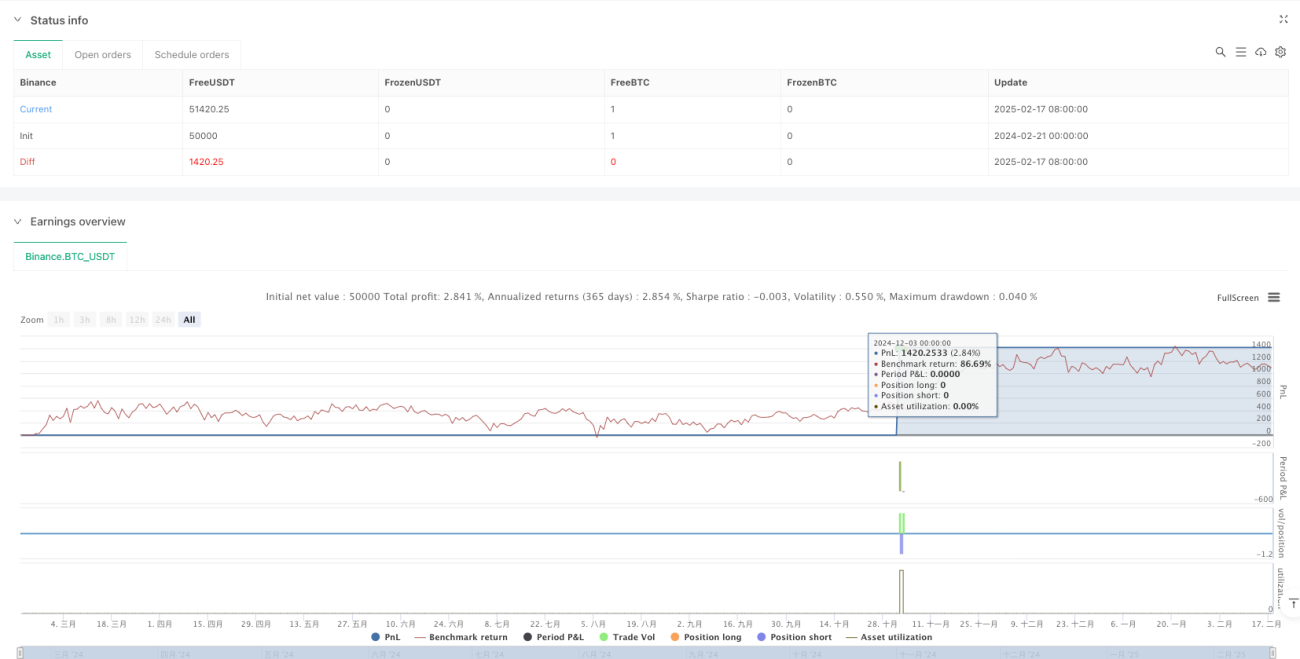
- Un système de stop-loss dynamique peut s'adapter automatiquement aux fluctuations du marché, améliorant la flexibilité de la gestion des fonds
- L'interface graphique affiche intuitivement les signaux de négociation et les positions de stop loss pour faciliter la compréhension et l'utilisation par les traders.
- Les paramètres de la stratégie peuvent être ajustés pour s'adapter à différentes conditions de marché
Risque stratégique
- Les arrêts de perte peuvent être fréquents dans des marchés très volatils
- La double confirmation des délais peut entraîner la perte de certaines opportunités commerciales
- Le stop-loss avec un multiplicateur fixe peut ne pas être adapté à toutes les conditions du marché.
- Il peut être prématuré d'arrêter une tendance forte
- Les paramètres doivent être raisonnablement définis pour équilibrer les bénéfices et les risques
Orientation de l'optimisation de la stratégie
- Introduction d'un mécanisme d'arrêt de perte adaptatif qui s'adapte à la dynamique des fluctuations du marché
- Ajout d'un filtre de tendance pour modifier la direction des transactions dans une tendance forte
- Ajout d'un indicateur de volume de transaction comme signal de confirmation auxiliaire
- Développer un système de gestion de position plus intelligent
- Considérer l'ajout d'indicateurs de sentiment pour optimiser le moment de l'entrée sur le marché
Résumer
Il s'agit d'un système de trading complet qui combine l'analyse technique et la gestion des risques. Grâce à la confirmation des signaux et à l'arrêt dynamique des pertes sur plusieurs périodes, la stratégie offre un bon potentiel de gain tout en garantissant la stabilité. Cependant, l'utilisateur doit optimiser les paramètres en fonction de son style de trading et de l'environnement du marché, tout en maintenant un contrôle strict des risques.
- 1