Stratégie composite de suivi des tendances multi-périodes adaptatives dynamiques et d'inversion des chocs

Aperçu
Cette stratégie est un système de trading complexe qui combine le suivi des tendances et les échanges intermédiaires, l'identification de l'état du marché par le diagramme de Ichimoku Cloud, la confirmation de la dynamique MACD et l'indicateur de survente RSI, tout en utilisant l'ATR pour la gestion dynamique des pertes. La stratégie est capable de capturer des opportunités de tendance dans les marchés tendances et de rechercher des opportunités de revirement dans les marchés turbulents, avec une forte adaptabilité et flexibilité.
Principe de stratégie
La stratégie utilise un mécanisme de confirmation de signaux à plusieurs niveaux:
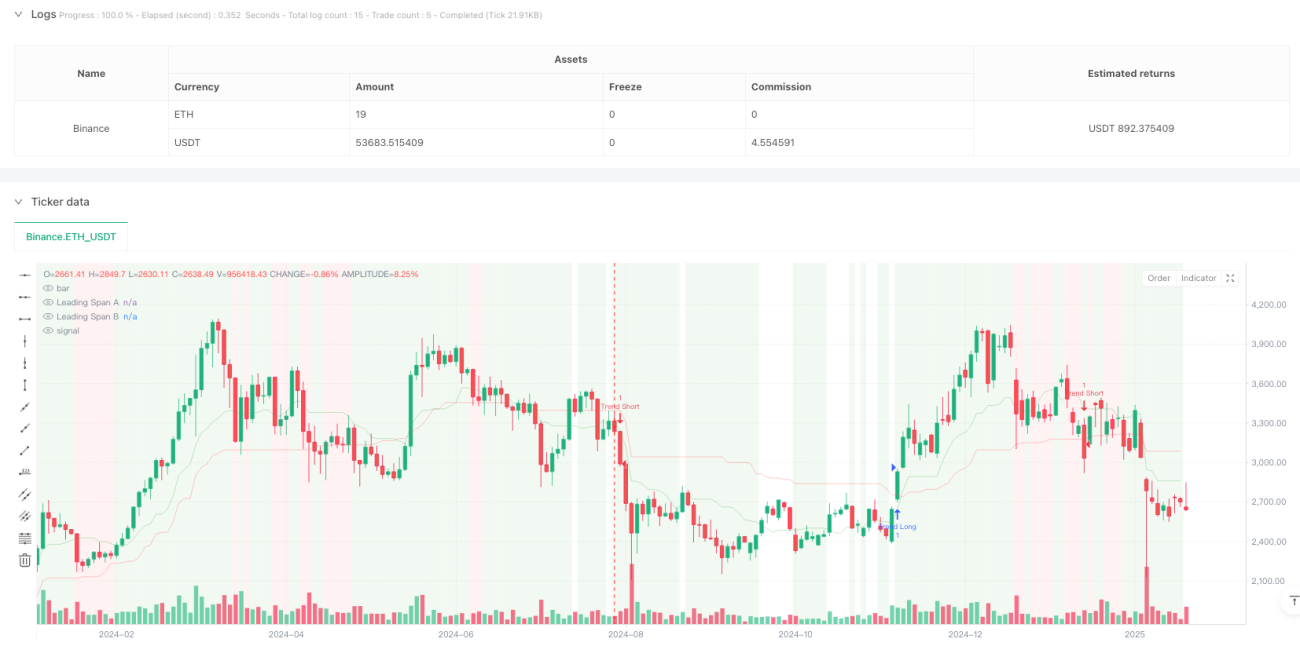
- Utilisez le diagramme de nuages d'ichimoku comme principal critère de jugement de l'état du marché, en déterminant si le marché est en tendance ou en tremblement par la relation entre la position des prix et celle du nuage
- Dans un marché en tendance, l'entrée est plus forte lorsque le prix est au-dessus du nuage et que le RSI est supérieur à 55 et que le graphique MACD est positif; l'entrée est vide lorsque le prix est au-dessous du nuage et que le RSI est inférieur à 45 et que le graphique MACD est négatif
- Dans un marché en tremblement de terre, recherchez des opportunités de plus lorsque le RSI est < 30 et le RSI est < 20 au hasard; recherchez des opportunités de moins lorsque le RSI est > 70 et le RSI est > 80 au hasard
- Gérer le risque en utilisant un stop-loss dynamique basé sur l'ATR, avec un stop-loss deux fois plus éloigné que l'ATR
Avantages stratégiques
- Adaptabilité du marché: capacité à ajuster automatiquement les stratégies de négociation en fonction des différentes conditions du marché, ce qui améliore la stabilité des stratégies
- Signal fiable: un mécanisme de vérification multi-indicateurs est utilisé pour réduire l'impact des faux signaux.
- Le contrôle des risques est parfait: avec l'arrêt dynamique des pertes ATR, les bénéfices peuvent être pleinement développés et les risques efficacement contrôlés
- L'effet de visualisation est bon: marquez l'état du marché par la couleur de fond, ce qui permet aux traders de comprendre intuitivement l'environnement du marché
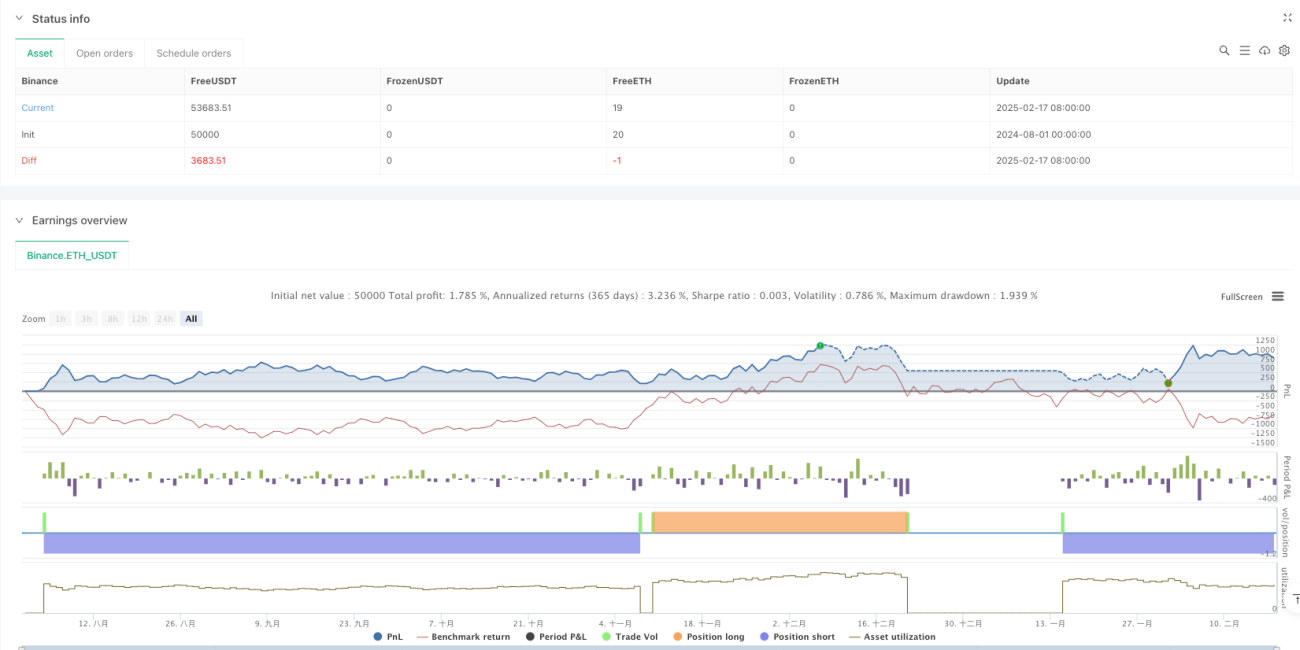
- Excellente performance sur les cycles à temps élevé: avec un facteur de profit de 2,159 sur les cycles à jour, le bénéfice net atteint 10,71%
Risque stratégique
- Faible taux de réussite: moins de 40% de réussite sur chaque période, nécessitant une plus grande endurance psychologique
- Excessive transaction dans des cycles de temps bas: 430 transactions ont été exécutées dans des cycles de 4 heures, avec une faible efficacité
- Rarité de signaux: des opportunités de marché pourraient être manquées en raison de l'utilisation de vérifications multi-indicateurs
- La difficulté d'optimisation des paramètres: la combinaison de plusieurs indicateurs augmente la complexité de l'optimisation des stratégies
Orientation de l'optimisation de la stratégie
- Optimisation du filtrage des signaux: amélioration du taux de réussite en ajustant les seuils de chaque indicateur
- Adaptation du cycle de temps: recommandé pour une utilisation principalement dans le cycle de la ligne solaire et au-dessus, les paramètres peuvent être ajustés en fonction des différentes caractéristiques du marché
- Optimisation des arrêts de perte: il peut être envisagé d'ajuster le multiplicateur ATR en fonction de la dynamique des différentes conditions du marché
- Optimisation du temps d'entrée: vous pouvez ajouter la confirmation de la quantité ou la confirmation de la forme du prix pour améliorer la précision de l'entrée
- Optimisation de la gestion de position: un système de gestion de position dynamique peut être conçu en fonction de l'intensité du signal
Résumer
La stratégie est un système de négociation intégré, conçu de manière rationnelle et logique, qui permet une identification intelligente de l'état du marché et une capture précise des opportunités de négociation grâce à l'utilisation combinée de multiples indicateurs. Bien qu'il y ait quelques problèmes dans les périodes de temps bas, il se comporte de manière optimale dans les périodes de temps plus élevées telles que la ligne du jour. Il est recommandé aux traders de prêter une attention particulière aux signaux du niveau de la ligne du jour et d'ajuster raisonnablement les paramètres en fonction de leur propre tolérance au risque.
- 1