Stratégie de suivi de tendance d'écart type des bandes de Bollinger triples

Aperçu
La stratégie est un système de suivi des tendances basé sur l'écart-type de la ceinture de Brin. La stratégie détermine la force de la tendance en observant la relation entre la position de trois lignes de coupe consécutives par rapport à la ceinture de Brin sur la voie descendante et effectue des transactions lorsque la tendance est établie. Le système utilise un rapport de risque/bénéfice fixe pour gérer le risque de chaque transaction.
Principe de stratégie
La logique fondamentale de la stratégie repose sur les points suivants :
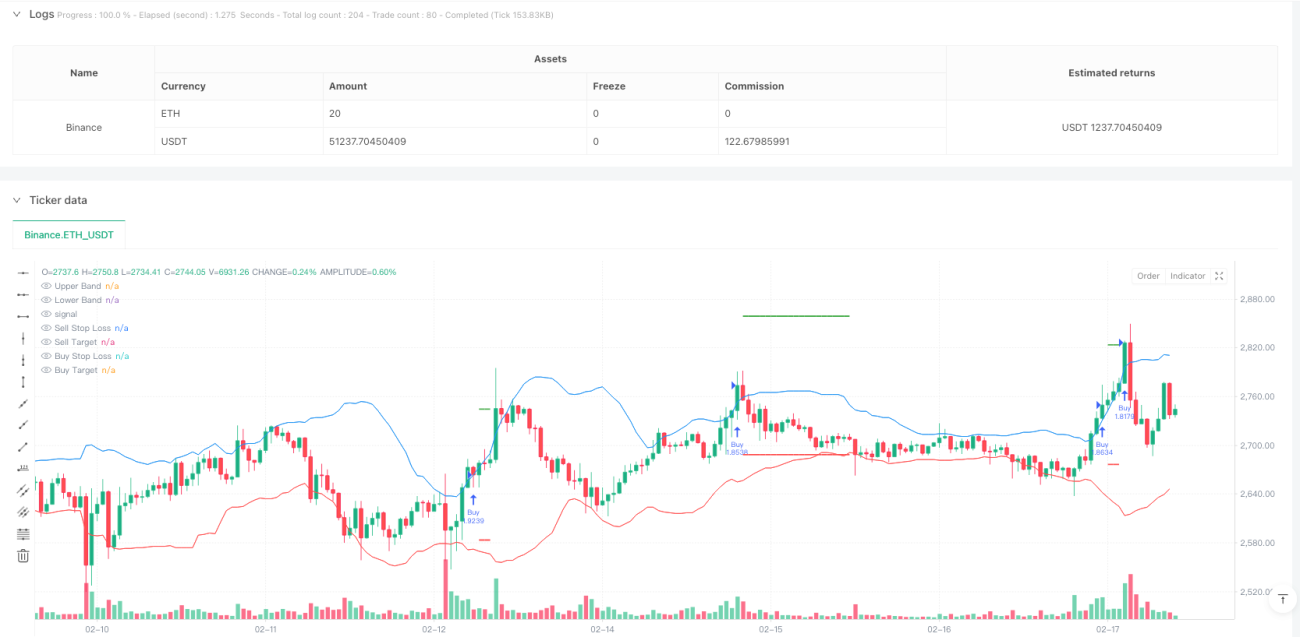
- La moyenne mobile à 20 cycles est utilisée comme moyenne de la bande de Bryn, et le décalage standard est calculé en utilisant 2 fois le décalage.
- Lorsque la clôture des trois lignes de coupe consécutives se situe au-dessus de la trajectoire ascendante, le système considère que la tendance haussière est établie et fait plus d'entrée lorsque la troisième ligne de coupe se termine.
- Lorsque les trois lignes de clôture consécutives sont en dessous de la trajectoire descendante, le système considère que la tendance à la baisse est établie, et la clôture de la troisième ligne de clôture entraîne une clôture à vide.
- Le stop loss est réglé à la limite de la ligne d'aiguille la plus proche du signal d'entrée.
- Le prix cible est fixé avec un rapport risque/bénéfice de 1:1, c'est-à-dire que la distance de la cible de profit est égale à la distance de l'arrêt de perte.
Avantages stratégiques
- Le mécanisme de confirmation des signaux est robuste - il nécessite trois lignes de câble consécutives pour percer la bande de Brin, ce qui réduit efficacement le risque de fausse perte.
- La gestion des risques est raisonnable - les transactions sont gérées avec un rapport de risque/bénéfice fixe, ce qui évite des pertes excessives pour une seule transaction.
- L'effet de suivi de la tendance est significatif - la propriété de l'écart-type des bandes de Bryn permet à la stratégie de s'adapter aux variations de la volatilité du marché.
- Les règles d'exécution sont claires - les objectifs d'entrée, de stop-loss et de profit sont définis selon des critères quantifiables et ne nécessitent pas de jugement subjectif.
Risque stratégique
- Les marchés horizontaux ont un mauvais rendement - des faux signaux peuvent être fréquents dans les marchés sans tendance évidente.
- Le temps d'entrée est un peu retardé - il faut attendre la confirmation des trois lignes pour l'accès et peut-être manquer les premières étapes de la procédure.
- Limitation du ratio risque/revenu fixe - un ratio risque/revenu de 1:1 peut être trop précoce dans une tendance forte.
- Absence de filtrage de la force de la tendance - se basant uniquement sur la relation entre les prix et les courbes de Brent, sans tenir compte des autres indicateurs de confirmation de tendance.
Orientation de l'optimisation de la stratégie
- Augmentation des filtres d'intensité de tendance - des indicateurs de tendance tels que ADX ou MACD peuvent être introduits pour améliorer la qualité du signal.
- Optimiser les paramètres du rapport risque/bénéfice - le rapport risque/bénéfice peut être ajusté en fonction de la dynamique de la volatilité du marché.
- Améliorer les mécanismes d'arrêt - envisager d'augmenter les mécanismes d'arrêt mobile ou de profit par lots pour mieux saisir les grandes tendances.
- Ajout de confirmation de transaction - augmentation de la confirmation de transaction lors de la génération du signal, améliorant ainsi la fiabilité du signal.
Résumer
Il s'agit d'une stratégie de suivi de tendance conçue de manière rationnelle pour capturer les tendances du marché grâce à des bandes de Brin et à des mécanismes de confirmation multiples. Le cadre de gestion des risques de la stratégie est parfait et les critères d'exécution sont clairs. Bien qu'il y ait un certain retard, la stabilité et la rentabilité de la stratégie peuvent être encore améliorées par l'orientation optimisée proposée.
/*backtest
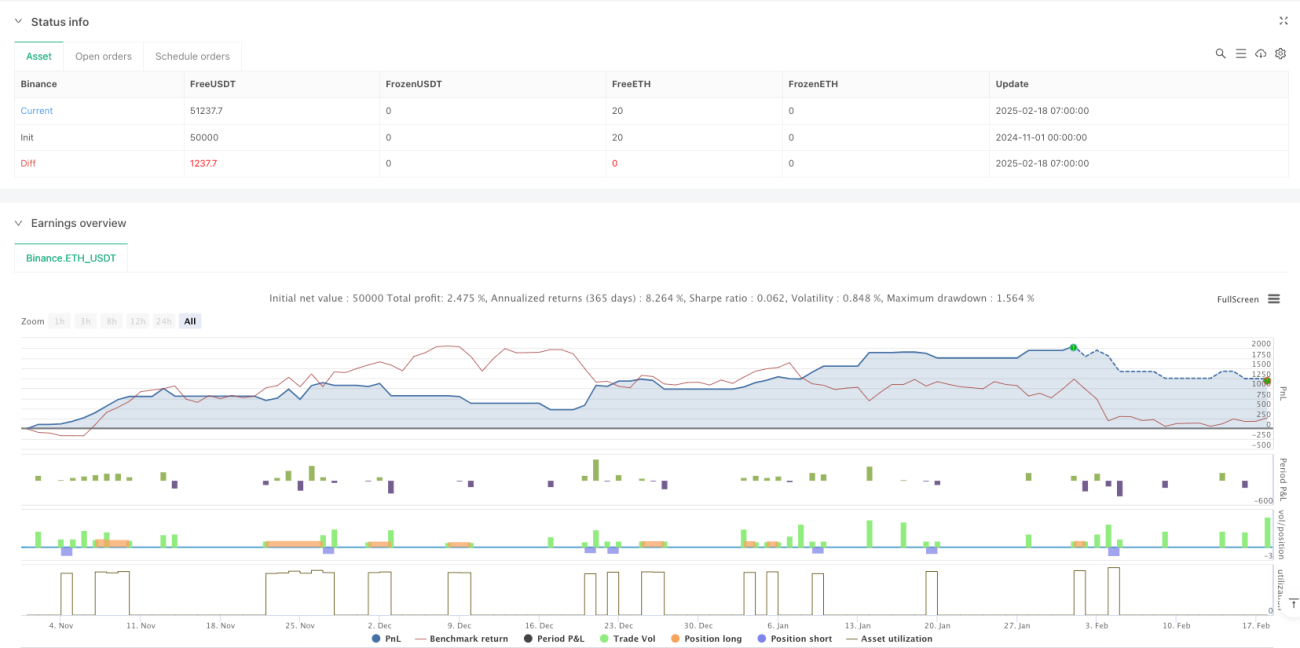
start: 2024-11-01 00:00:00
end: 2025-02-18 08:00:00
period: 1h
basePeriod: 1h
exchanges: [{"eid":"Binance","currency":"ETH_USDT"}]
*/
//@version=6
strategy("Bollinger Band Buy and Sell Strategy (Entry at Close of 3rd Candle)", overlay=true, default_qty_type=strategy.percent_of_equity, default_qty_value=10, pyramiding=0)
// Bollinger Band settings- 1