
Aperçu
La stratégie est un système de suivi de tendance combinant plusieurs indicateurs techniques. Elle est principalement basée sur les signaux croisés du RSI, du MACD et du SMA pour déterminer la direction des transactions, tout en utilisant les indicateurs ATR pour ajuster dynamiquement les niveaux de stop-loss et de gain. La stratégie intègre également un filtre de volume de transactions pour assurer la négociation avec une liquidité suffisante sur le marché et utilise une partie du mécanisme de stop-loss pour optimiser la gestion des fonds.
Principe de stratégie
La stratégie utilise un mécanisme de triple vérification pour confirmer les signaux de transaction:
- Les principales tendances sont définies par la relation entre les positions de 50 et de 200
- Utilisez le RSI pour trouver des opportunités d'entrée à la croisée des zones de survente
- La dynamique de la tendance est confirmée en combinaison avec les indicateurs MACD
- Utilisation d'un filtre de volume pour assurer une liquidité adéquate du marché
- La mise en place d'objectifs de stop-loss et de profit dynamiques basés sur l'ATR
Le but de la multi-vérification est de réduire les faux signaux et d'améliorer l'exactitude des transactions. La stratégie consiste à faire plusieurs conditions (trend à la hausse + RSI à travers 40 + MACD à la hausse + confirmation du volume de transaction) pour ouvrir une position et utiliser 2 fois l'ATR comme arrêt-perte et 4 fois comme arrêt.
Avantages stratégiques
- Vérification croisée de multiples indicateurs techniques pour réduire efficacement les faux signaux
- Un mécanisme dynamique d'arrêt des fluctuations, adapté aux différents environnements de marché
- Une stratégie de blocage partiel pour bloquer une partie des bénéfices tout en conservant une marge de progression
- Le filtrage du volume des transactions assure une liquidité suffisante du marché
- Système complet de gestion des risques, y compris les arrêts fixes, le suivi des arrêts et des gains partiels
Risque stratégique
- La multiplication des indicateurs pourrait entraîner la perte de certaines opportunités commerciales
- Pourrait subir des baisses importantes dans des marchés volatils
- Une optimisation excessive des paramètres peut conduire à un surapprentissage
- Le filtrage du volume des transactions pourrait être une occasion manquée dans un marché à faible liquidité
- Les pertes dynamiques peuvent être déclenchées prématurément pendant une période de forte volatilité
Orientation de l'optimisation de la stratégie
- Considérer l'ajout d'un mécanisme d'adaptation à la volatilité du marché, afin d'ajuster dynamiquement les paramètres dans différents environnements de volatilité
- L'introduction de l'analyse pluricyclique pour améliorer la précision des jugements de tendances
- Optimiser le taux de coupe partielle et adapter la stratégie de coupe aux différents environnements de marché
- Augmentation des filtres d'intensité de tendance pour éviter de négocier dans un environnement de tendance faible
- Considérer l'ajout d'analyses saisonnières pour optimiser le timing des transactions
Résumer
Il s'agit d'une stratégie globale de suivi des tendances, qui établit un système de négociation robuste grâce à l'utilisation combinée de multiples indicateurs techniques. La principale caractéristique de la stratégie est de s'adapter aux changements du marché grâce à des mécanismes de stop-loss et de profit dynamiques tout en garantissant la sécurité. Bien qu'il existe des endroits qui nécessitent une optimisation, le cadre global est raisonnable et convient à un perfectionnement ultérieur et à des tests en direct.
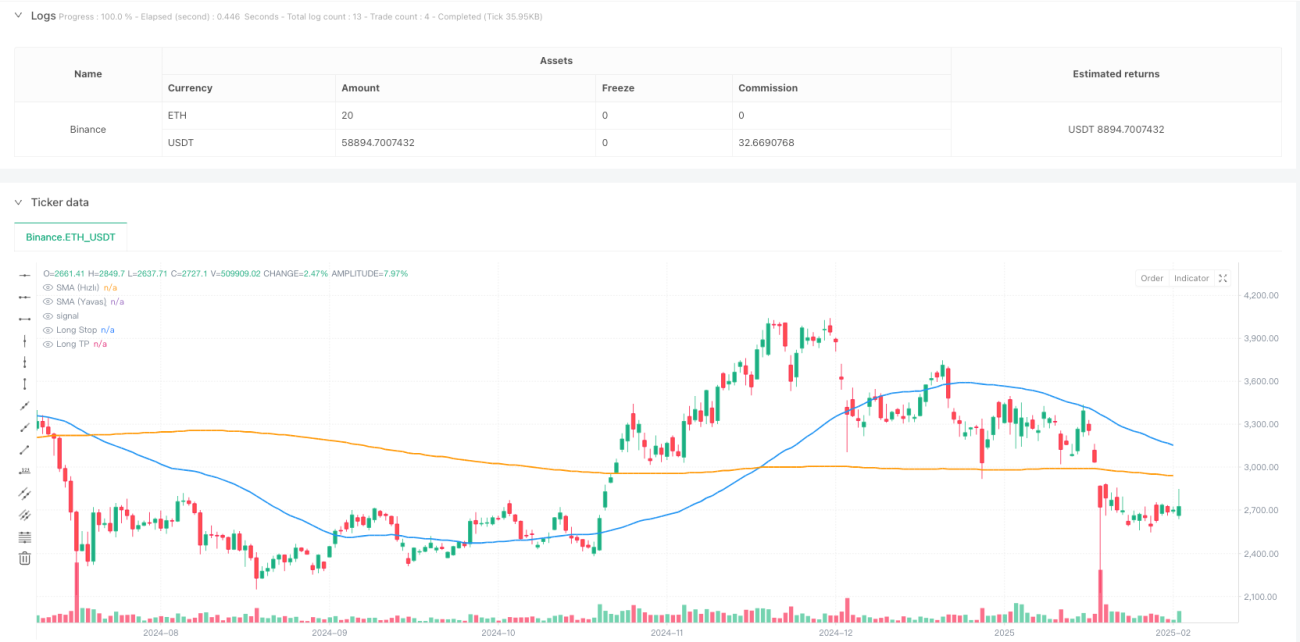
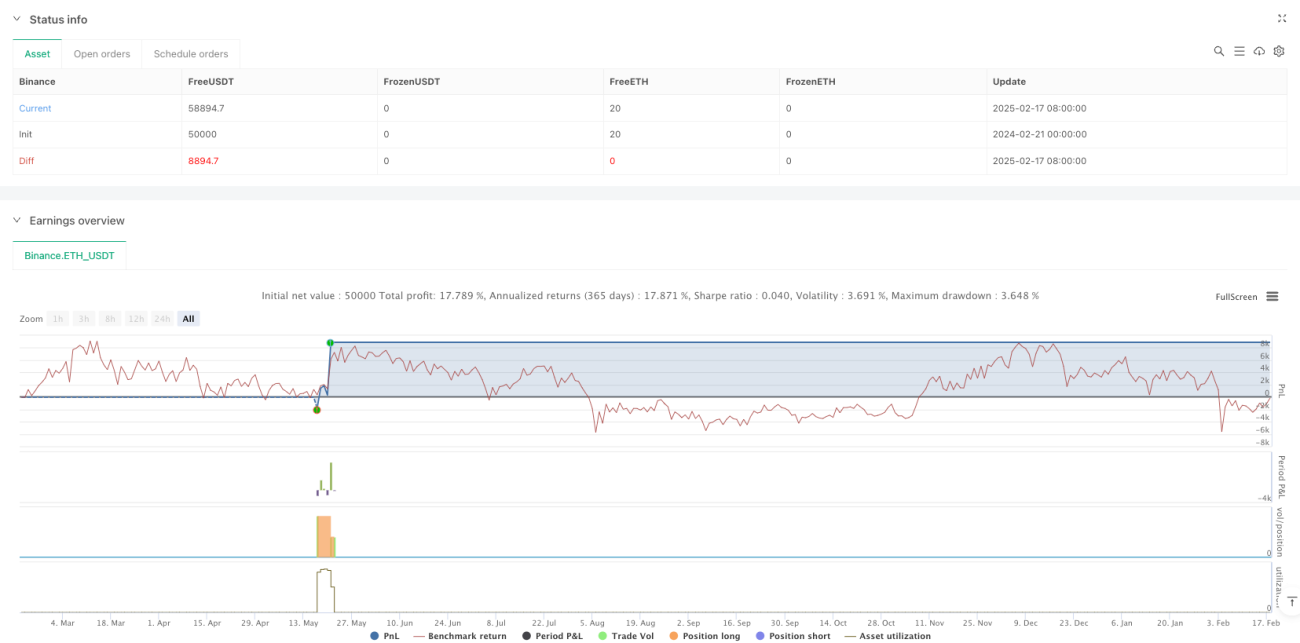
/*backtest
start: 2024-02-21 00:00:00
end: 2025-02-18 08:00:00
period: 1d
basePeriod: 1d
exchanges: [{"eid":"Binance","currency":"ETH_USDT"}]
*/

//@version=5
strategy(    title="AI Trade Strategy v2 (Extended) - Fixed",    shorttitle="AI_Trade_v2",    overlay=true,    format=format.price,    initial_capital=100000,    default_qty_type=strategy.percent_of_equity,    default_qty_value=100,    pyramiding=0)

//============================================================================- 1