Stratégie de suivi des tendances croisées multi-indicateurs combinée au retracement de Fibonacci et au système d'optimisation stop-profit et stop-loss

Aperçu
La stratégie est un système de négociation intégré qui combine les croisements des moyennes mobiles indicielles (EMA), des niveaux de rétroaction de Fibonacci, des jugements de tendance et un mécanisme de stop-loss. La stratégie détermine les signaux de négociation par le croisement des EMAs de 9 cycles et de 21 cycles, tout en combinant les niveaux de rétroaction de Fibonacci pour optimiser les positions d'entrée et améliorer l'exactitude des transactions grâce à la surveillance en temps réel de l'état de la tendance.
Principe de stratégie
La logique fondamentale de la stratégie repose sur les éléments clés suivants :
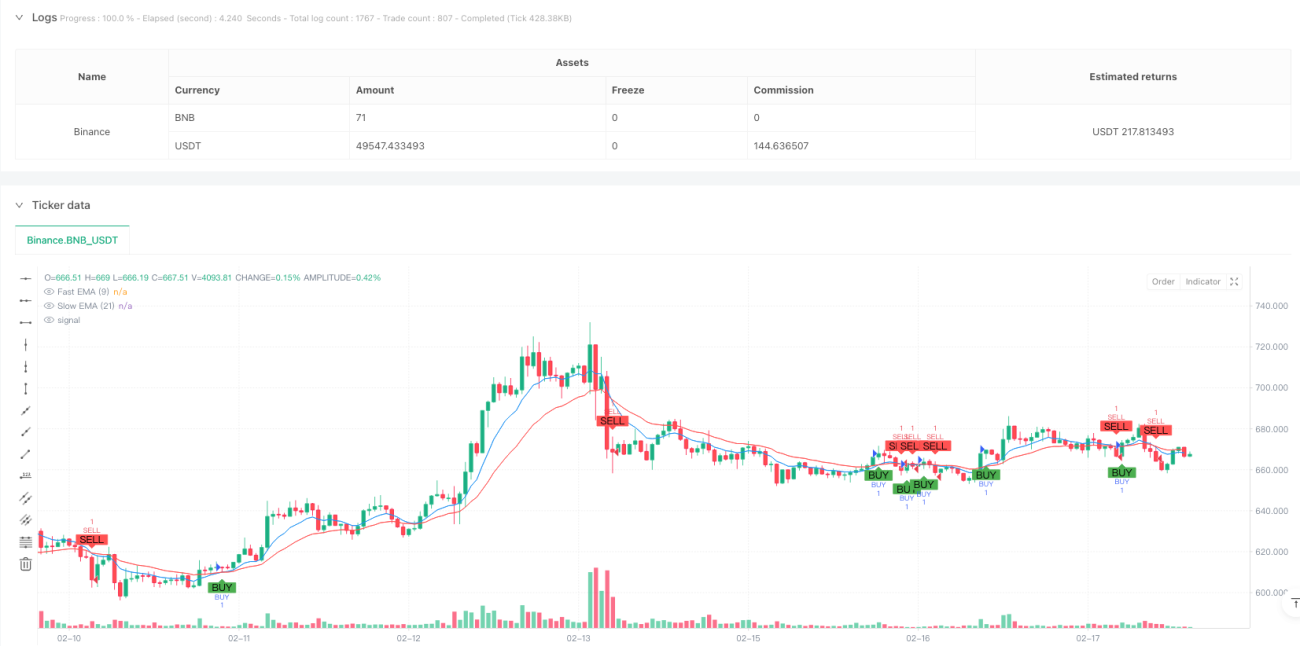
- Lorsque l'EMA rapide ((cycle 9)) traverse vers le haut l'EMA lente ((cycle 21), le système génère un signal de multiplication
- Lorsque l'EMA rapide traverse l'EMA lente vers le bas, le système génère un signal de vide
- En calculant les prix maximaux et minimaux sur 100 cycles, les niveaux de régression de Fibonacci de 23,6%, 38,2%, 50% et 61,8% sont tracés
- Jugez l'état actuel de la tendance par la relation entre la position de la clôture et celle de l'EMA rapide
- Lors de l'exécution d'une transaction, le système définit automatiquement un stop-loss à un pourcentage fixe (environ 4%) et un stop-loss (environ 2%).
Avantages stratégiques
- Confirmation de signaux multidimensionnels: offre des signaux de négociation plus fiables combinés à des croisements EMA, des niveaux de Fibonacci et des états de tendance
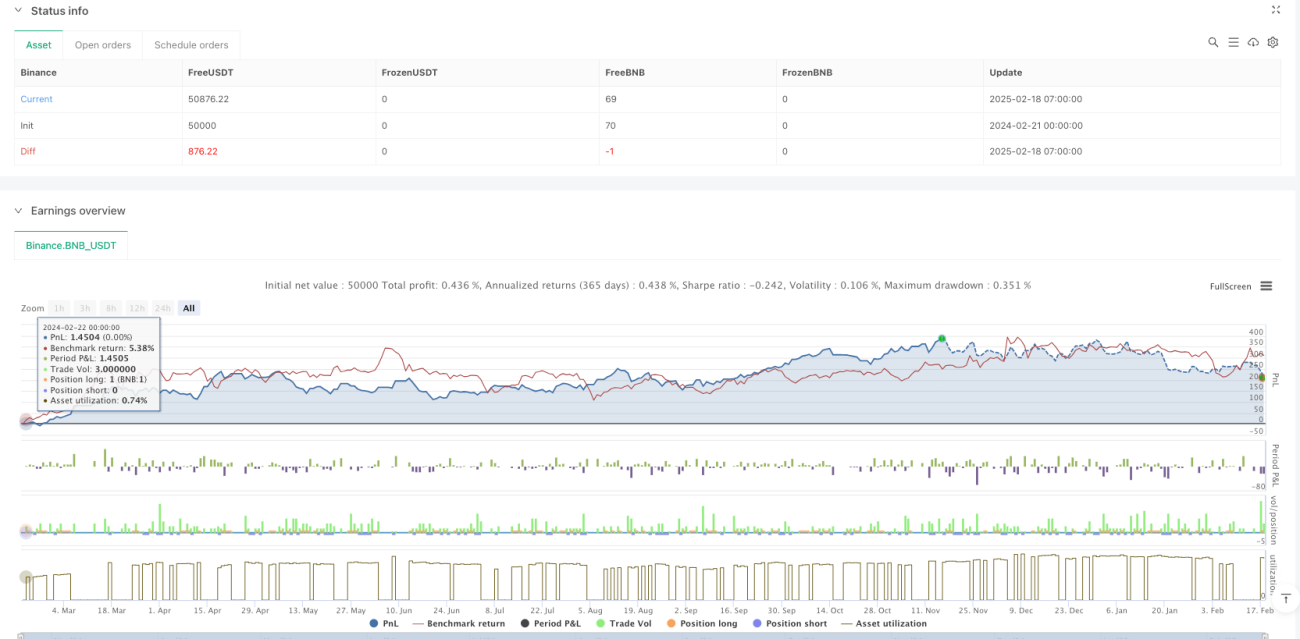
- Gestion des risques: contrôle automatique des risques grâce à un stop loss par défaut
- La capacité de suivi des tendances est forte: l'EMA croisée est associée à la détermination de l'état de la tendance, captant efficacement les tendances du marché.
- Retour visuel clair: aide à la prise de décision en affichant les niveaux de prix, les tendances et les signaux de négociation clés
- Un niveau élevé de systématisation: logique de transaction claire, réduction des interférences avec les jugements subjectifs
Risque stratégique
- Risque de marché oscillant: des croisements fréquents d'EMA peuvent conduire à de faux signaux pendant la phase de liquidation horizontale
- Risque de retard: les moyennes mobiles sont essentiellement un indicateur de retard qui peut manquer le meilleur moment d'entrée
- Risque de stop-loss fixe: le pourcentage de stop-loss fixe prédéfini peut ne pas être adapté à toutes les conditions du marché
- Risque de conflit de signaux: il peut y avoir des signaux contradictoires entre plusieurs indicateurs, ce qui rend la prise de décision plus difficile
- Risque de fluctuation du marché: une forte volatilité peut conduire à un point de rupture déraisonnable
Orientation de l'optimisation de la stratégie
- Optimisation des arrêts dynamiques: les arrêts peuvent être ajustés en fonction de l'ATR ou de la dynamique des fluctuations du marché
- Amélioration du filtrage des signaux: augmentation des indicateurs auxiliaires tels que le trafic et la puissance pour filtrer les faux signaux
- Adaptation des paramètres: introduction d'un mécanisme d'adaptation qui modifie le cycle EMA en fonction de la dynamique du marché
- Optimisation de l'entrée: optimisation de l'entrée autour des niveaux de Fibonacci, combinée à la forme des prix et au volume des transactions
- Gestion de position perfectionnée: un système de gestion de position dynamique conçu en fonction de la volatilité et du risque du compte
Résumer
Cette stratégie a pour avantage d'être multi-dimensionnelle dans la reconnaissance des signaux et systématisée dans la gestion des risques, mais nécessite toujours une optimisation pour les différents environnements de marché. Il est recommandé aux traders d'optimiser l'ajustement des paramètres en fonction des conditions spécifiques du marché et de rester toujours vigilants face au risque.
- 1