
Aperçu
Il s'agit d'une stratégie de négociation innovante à cycles multiples combinant l'exposant Hurst et le niveau de rétraction Fibonacci. La stratégie évalue les caractéristiques de la tendance du marché en calculant l'exposant Hurst pour différentes périodes de temps et identifie les opportunités de négociation potentielles en combinaison avec les niveaux de prix critiques Fibonacci. La stratégie utilise un cadre de gestion du risque strict, comprenant des ratios de risque fixes, des marges de gain et de perte cibles et des limites de fréquence de négociation quotidienne et globale.
Principe de stratégie
La logique centrale de la stratégie repose sur deux composantes principales:
- L'indice de Hurst est utilisé pour évaluer la tendance du marché en calculant l'indice de Hurst pour les périodes actuelles et supérieures. Un indice de Hurst supérieur à 0,5 indique que le marché a tendance à la continuité, et un indice inférieur à 0,5 indique que le marché peut présenter des caractéristiques de régression de la moyenne.
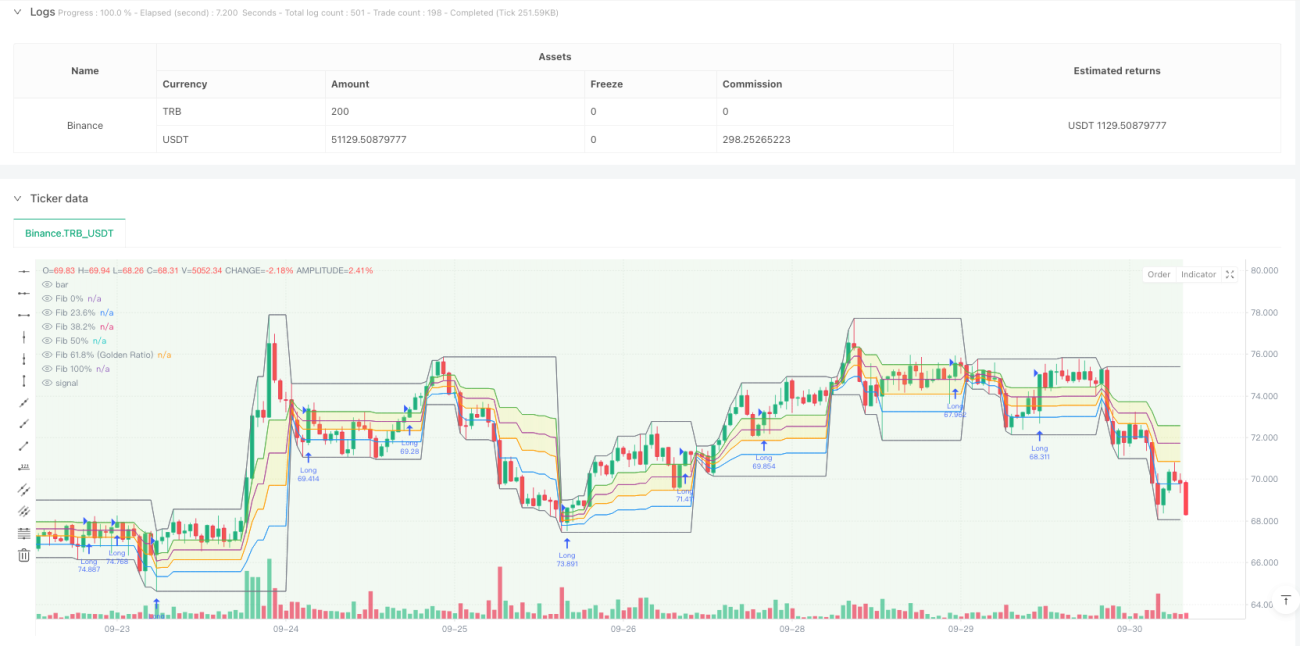
- Utilisez le niveau de rétractation Fibonacci pour calculer les hauts et les bas de chaque jour, en se concentrant sur les deux niveaux de 61.8% (la division de l'or) et 38.2%. Si l'indice de jour est supérieur à 0.5 et que le prix franchit le niveau de 61.8%, déclenchez un signal plus; Si l'indice de jour est inférieur à 0.5 et que le prix franchit le niveau de 38.2%, déclenchez un signal vide.
Avantages stratégiques
- Analyse multidimensionnelle: fournit une perspective plus complète du marché en combinant l'analyse des tendances et des niveaux de prix pour différentes périodes de temps
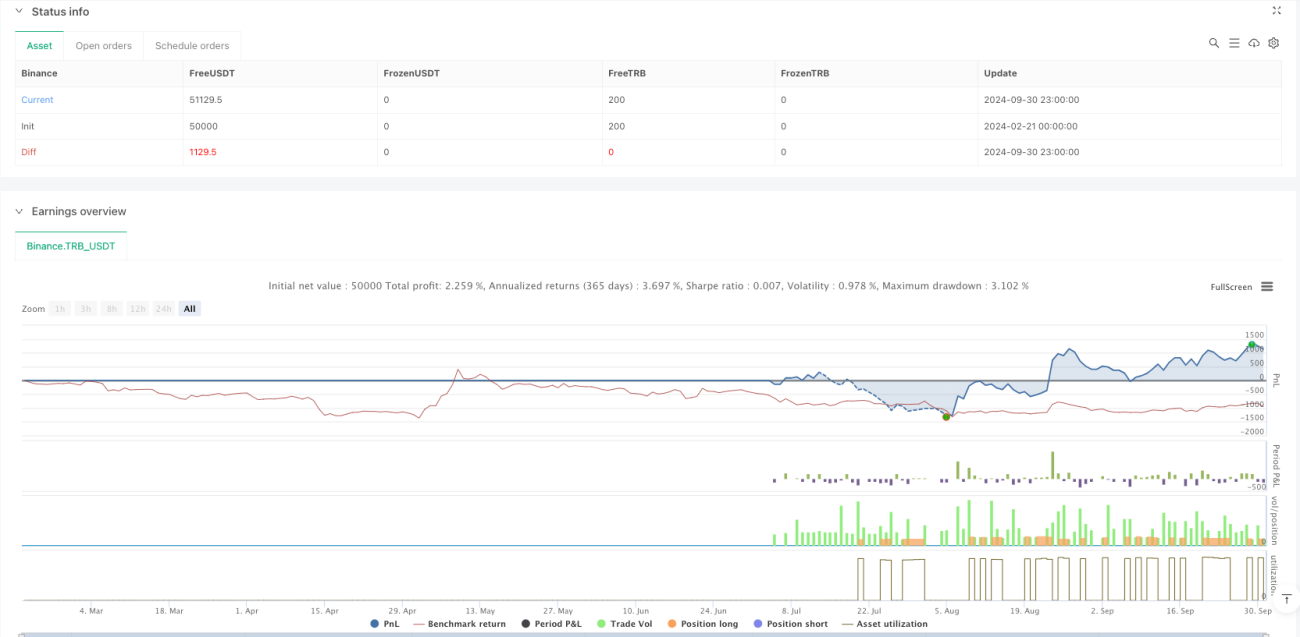
- Gestion des risques: un cadre de gestion des risques avec un ratio de risque fixe de 2 pour cent et un objectif de profit/perte de 1 pour cent
- Contrôle de la fréquence des transactions: définissez des limites de nombre maximum de transactions par jour et de nombre total de transactions, afin d'éviter les transactions excessives
- Aide visuelle: Tableau d'informations sur les changements de couleurs de fond et les indicateurs clés pour les tendances du marché en temps réel
Risque stratégique
- Dépendance aux conditions du marché: risque de sous-performance sur des marchés horizontaux où la tendance n'est pas claire
- Sensitivité des paramètres: le choix de la période de calcul de l'indice de Hurst et de la période de temps de Fibonacci affecte la performance de la stratégie
- Effets de dérapage: un risque de dérapage plus élevé est possible dans des conditions de marché moins fluides
- Complexité du système: la combinaison de plusieurs composants augmente la probabilité que la stratégie échoue
Orientation de l'optimisation de la stratégie
- Ajustement des paramètres dynamiques: les cycles de calcul de l'indice de Hurst peuvent être automatiquement ajustés en fonction des fluctuations du marché
- Ajout de filtres: introduction de filtres supplémentaires de l'état du marché pour améliorer la qualité du signal
- Optimisation de la gestion des positions: mise en œuvre d'une gestion dynamique des positions basée sur la volatilité
- Améliorer les mécanismes de départ: développer des méthodes plus flexibles de fixation des objectifs de profit
Résumer
Il s'agit d'une stratégie innovante qui combine les outils classiques de l'analyse technique avec des méthodes modernes de quantification. Par l'analyse de plusieurs cycles de temps et la gestion rigoureuse des risques, la stratégie maintient la base théorique tout en mettant l'accent sur la faisabilité pratique. Bien qu'il existe une certaine marge d'optimisation, le cadre global présente une bonne extensibilité et une valeur pratique.
- 1