Combinaison multi-indicateurs ATR trailing stop loss stratégie de trading intelligente
ATR EMA VWMA SMA JLines Cloud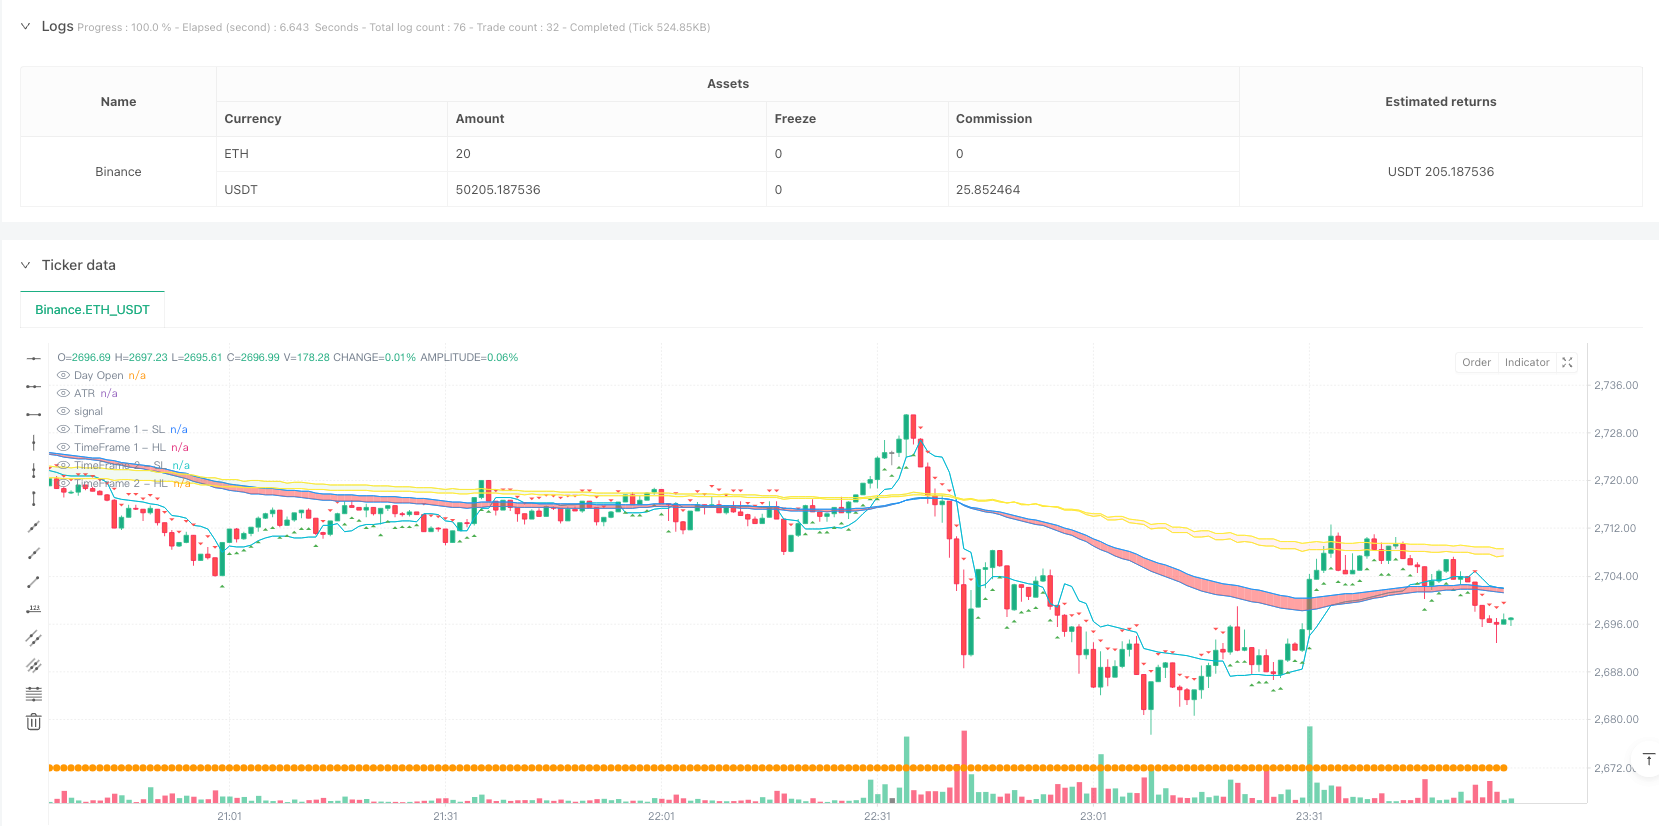
Aperçu
Il s’agit d’une stratégie de trading intelligente combinant plusieurs indicateurs techniques, principalement basée sur l’indicateur ATR pour réaliser la fonction de suivi des arrêts. La stratégie intègre également des indicateurs d’analyse multidimensionnels tels que le nuage de lignes directrices (JLines Cloud), l’analyse du volume des transactions et le prix d’ouverture du jour, particulièrement adaptés aux transactions sur des périodes de 3 et 5 minutes.
Principe de stratégie
Le cœur de la stratégie est un système de suivi de stop-loss construit sur l’indicateur ATR. Il utilise l’ATR de 10 cycles et le multiple de 2 fois l’ATR pour calculer la ligne de stop-loss dynamique. Il intègre également le système JLines Cloud de deux périodes de temps.
- ATR suit une rupture de la ligne de freinage
- JLines Cloud pour les deux périodes
- Position du prix par rapport au cours d’ouverture de la journée
- Confirmation de la quantité de transactions anormales
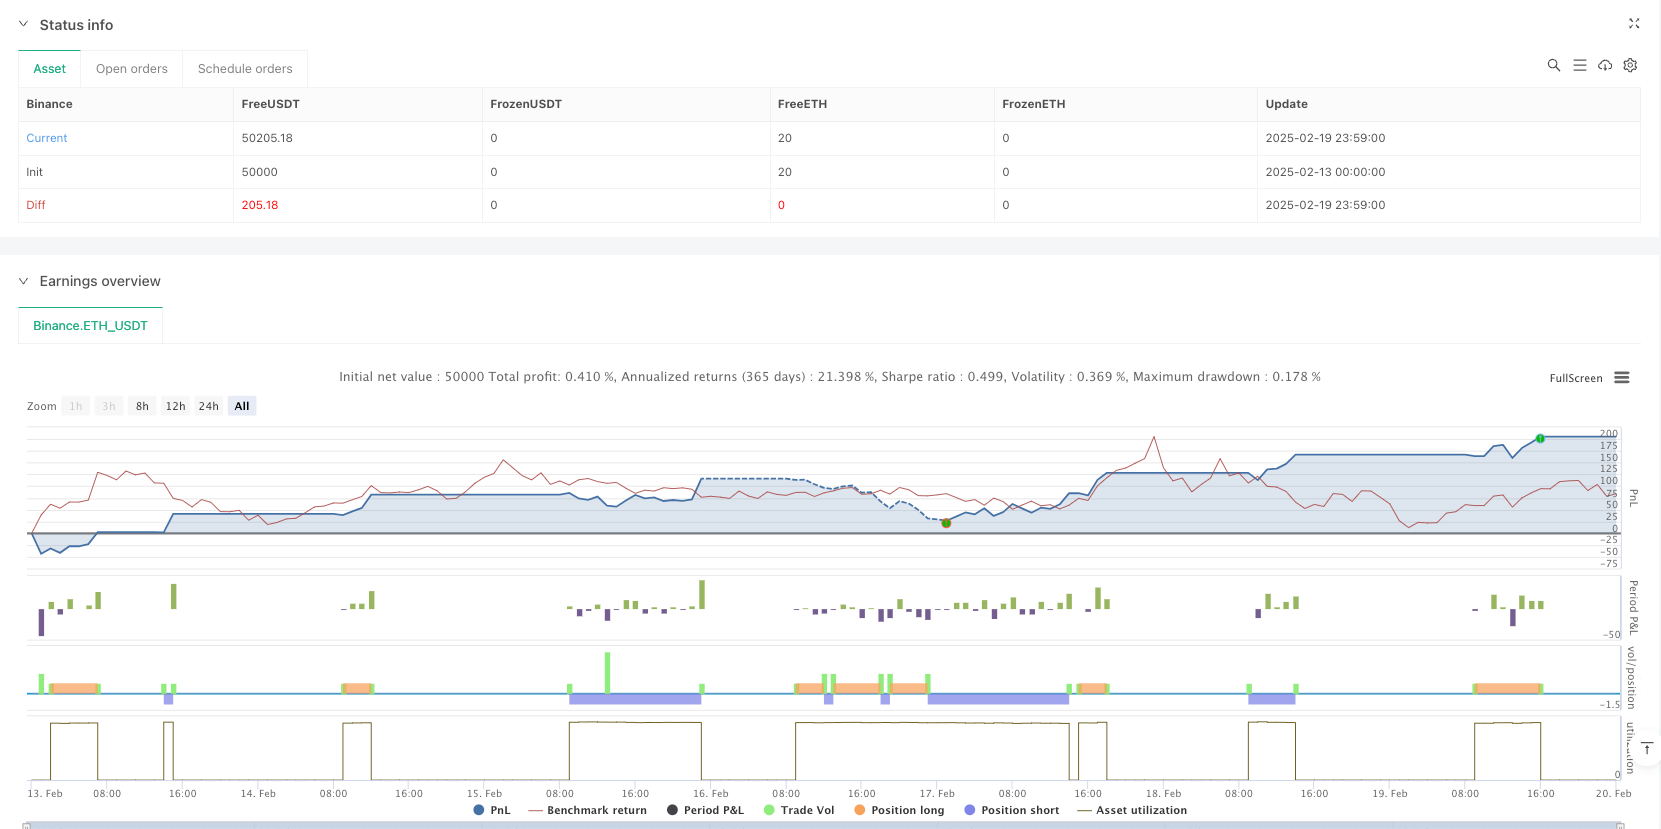
Avantages stratégiques
- La protection contre les pertes dynamiques - offre une protection contre les pertes souple en s’adaptant aux fluctuations du marché grâce à l’indicateur ATR
- Confirmation de tendance multidimensionnelle - utilisation d’une combinaison de lignes moyennes de différentes périodes de temps pour améliorer la précision des jugements de tendance
- Vérification du volume des transactions - augmentation de la confirmation des transactions grâce à une analyse du volume des transactions anormales
- Gestion des risques de manière optimale - un double mécanisme de protection comprenant des objectifs de stop loss et de profit fixes
- Adaptabilité - les paramètres peuvent être ajustés en fonction des différentes conditions du marché
Risque stratégique
- Sensibilité des paramètres - le choix des cycles et des multiplications d’ATR peut avoir un impact significatif sur la performance de la stratégie
- La dépendance aux conditions du marché - les faux signaux peuvent apparaître fréquemment dans les marchés horizontaux
- Restrictions de conditions multiples - les conditions d’entrée strictes peuvent entraîner la perte de certaines opportunités de négociation
- Effets de point de glissement - pendant les périodes de forte volatilité, le prix d’exécution réel peut être plus éloigné du prix du signal
Orientation de l’optimisation de la stratégie
- Ajustement des paramètres dynamiques - les paramètres ATR peuvent être ajustés automatiquement en fonction de la volatilité du marché
- Filtre temporel - Ajout d’un filtre temporel pour les transactions afin d’éviter les périodes de forte volatilité de l’ouverture et de la fermeture du marché
- Filtrage de la force de tendance - l’introduction d’un indicateur de force de tendance pour améliorer l’exactitude des jugements de tendance
- Optimisation de la gestion des risques - réalisation d’un stop-loss dynamique adapté à différents environnements de marché
- Amélioration de l’analyse des volumes de transactions - affination des méthodes d’analyse des volumes de transactions et amélioration de l’exactitude des confirmations de transactions
Résumer
Il s’agit d’un système de négociation complet qui intègre plusieurs indicateurs techniques, fournissant une gestion de risque de base via le suivi des arrêts de perte ATR, tout en fournissant une confirmation de transaction à l’aide d’une nuée homogène et d’une analyse de volume de transaction. L’avantage de la stratégie réside dans son cadre d’analyse de marché complet et son système de gestion du risque parfait, mais nécessite l’optimisation des paramètres pour des conditions de marché spécifiques.
/*backtest
start: 2025-02-13 00:00:00
end: 2025-02-20 00:00:00
period: 1m
basePeriod: 1m
exchanges: [{"eid":"Binance","currency":"ETH_USDT"}]
*/

//@version=6
strategy("AI trade Roney nifty value", overlay=true)

// User Inputs
atrPeriod = input.int(10, "ATR Period")
atrMultiplier = input.float(2, "ATR Multiplier")
target = input.float(40, "Target")
stopLoss = input.float(40, "Stop Loss")

// Calculate ATR-based trailing stop
atr = ta.atr(atrPeriod)
nLoss = atrMultiplier * atr
var float xATRTrailingStop = na

if na(xATRTrailingStop)
    xATRTrailingStop := close - nLoss
else
    if close > xATRTrailingStop[1] and close[1] > xATRTrailingStop[1]
        xATRTrailingStop := math.max(xATRTrailingStop[1], close - nLoss)
    else if close < xATRTrailingStop[1] and close[1] < xATRTrailingStop[1]
        xATRTrailingStop := math.min(xATRTrailingStop[1], close + nLoss)
    else
        xATRTrailingStop := close > xATRTrailingStop[1] ? close - nLoss : close + nLoss

// Define position and entry/exit prices
var int pos = na
pos := close[1] < xATRTrailingStop[1] and close > xATRTrailingStop[1] ? 1 :
       close[1] > xATRTrailingStop[1] and close < xATRTrailingStop[1] ? -1 : pos[1]

var bool isLong = false
var bool isShort = false

var float entryPrice = na
var float exitPrice = na
var float exitStop = na

// JLines Cloud indicator
sl = input.int(72, "Smaller length")
hl = input.int(89, "Higher length")

res = input.timeframe("1", "JLines - Time Frame 1")
res1 = input.timeframe("3", "JLines - Time Frame 2")
enable515 = input.bool(false, "5/15 EMA")
res2 = input.timeframe("5", "5/15 EMA")

ema1_72 = request.security(syminfo.tickerid, res, ta.ema(close, sl))
ema1_89 = request.security(syminfo.tickerid, res, ta.ema(close, hl))
ema2_72 = request.security(syminfo.tickerid, res1, ta.ema(close, sl))
ema2_89 = request.security(syminfo.tickerid, res1, ta.ema(close, hl))
ema3_5 = request.security(syminfo.tickerid, res2, ta.ema(close, 5))
ema3_15 = request.security(syminfo.tickerid, res2, ta.ema(close, 15))

// Plot JLines Cloud
p1_1 = plot(ema1_72, "TimeFrame 1 - SL", color=color.blue, display=display.none)
p1_2 = plot(ema1_89, "TimeFrame 1 - HL", color=color.blue, display=display.none)
p2_1 = plot(ema2_72, "TimeFrame 2 - SL", color=color.yellow, display=display.none)
p2_2 = plot(ema2_89, "TimeFrame 2 - HL", color=color.yellow, display=display.none)
p3_1 = plot(enable515 ? ema3_5 : na, "Late Day Fade - 5 EMA", color=color.yellow, display=display.none)
p3_2 = plot(enable515 ? ema3_15 : na, "Late Day Fade - 15 EMA", color=color.yellow, display=display.none)

fill(p1_1, p1_2, color=ema1_72 > ema1_89 ? color.new(color.green, 30) : color.new(color.red, 30), title="Background 1")
fill(p2_1, p2_2, color=ema2_72 > ema2_89 ? color.new(color.green, 90) : color.new(color.red, 90), title="Background 2")
fill(p3_1, p3_2, color=enable515 ? (ema3_5 > ema3_15 ? color.new(color.blue, 50) : color.new(color.red, 50)) : na, title="Late Day Fade")

// Plot Buy and Sell signals
plotshape(pos == 1, title="Buy", style=shape.triangleup, location=location.belowbar, color=color.green)
plotshape(pos == -1, title="Sell", style=shape.triangledown, location=location.abovebar, color=color.red)

// Volume Analysis
vol_length = input.int(20, "Volume SMA length", minval=1)
vol_avg = ta.sma(volume, vol_length)

unusual_vol_down = volume > vol_avg * 1.2 and close < open
unusual_vol_up = volume > vol_avg * 1.2 and close > open

barcolor(unusual_vol_down or unusual_vol_up ? color.yellow : na)

// ATR Indicator
len2 = input.int(20, minval=1, title="Smooth")
src = input.source(close, title="Source")
out = ta.vwma(src, len2)
avg1 = math.avg(out, xATRTrailingStop) // FIXED: Replaced `ta.avg()` with `math.avg()`

plot(avg1, color=color.aqua, title="ATR")

// Daily Open Line
dl = input.bool(true, "Show daily Open")
dopen = request.security(syminfo.tickerid, "D", open)
plot(dl ? dopen : na, title="Day Open", color=color.orange, style=plot.style_circles, linewidth=2)

// Strategy Entry Conditions
if pos == 1 and not isLong and ema1_72 > ema1_89 and ema2_72 > ema2_89 and ema1_72 > ema2_72 and close > dopen
    entryPrice := close
    exitPrice := close + target
    exitStop := entryPrice - stopLoss
    strategy.entry("Buy", strategy.long)
    strategy.exit("buy_target", "Buy", limit=exitPrice)
    isLong := true
    isShort := false

if pos == -1 and not isShort and ema1_72 < ema1_89 and ema2_72 < ema2_89 and ema1_72 < ema2_72 and close < dopen
    entryPrice := close
    exitPrice := close - target
    exitStop := entryPrice + stopLoss
    strategy.entry("Sell", strategy.short)
    strategy.exit("Sell_target", "Sell", limit=exitPrice)
    isLong := false
    isShort := true

// Stop Loss Handling
if strategy.position_size > 0 and close < entryPrice - stopLoss
    strategy.close("Buy", comment="Buy_Stop Loss")

if strategy.position_size < 0 and close > entryPrice + stopLoss
    strategy.close("Sell", comment="Sell_Stop Loss")