
Aperçu
La stratégie est un système de trading intégré de suivi des tendances, combinant plusieurs indicateurs techniques pour déterminer les tendances du marché et le moment de la transaction. Le cœur de la stratégie est basé sur des signaux croisés de moyennes mobiles simples rapides et lentes (SMA) et la confirmation de la tendance est effectuée à l'aide d'indicateurs de force relative (RSI) et d'indicateurs de tendance moyens (ADX), tout en utilisant la marge réelle (ATR) pour la gestion des risques.
Principe de stratégie
Le mécanisme de fonctionnement de la stratégie comprend principalement les éléments clés suivants:
- Identification de la tendance: utilisez le croisement entre SMA10 et SMA200 pour capturer les changements de tendance, la ligne rapide dépassant la ligne lente est considérée comme un signal de multiplication, par opposition à un signal de blanchiment.
- Confirmation de la tendance: avec la double confirmation du RSI et de l'ADX, le RSI doit franchir le niveau 50 et l'ADX doit être supérieur à 20 pour confirmer la force de la tendance.
- Contrôle des risques: un arrêt de perte dynamique basé sur l'ATR et une gestion des fonds pour limiter le risque d'une seule transaction.
- Gestion des positions: mise en place d'un mécanisme de trailing stop, qui permet d'ajuster dynamiquement les positions de stop loss pour bloquer les bénéfices.
Avantages stratégiques
- Vérification croisée de multiples indicateurs pour améliorer la fiabilité du signal
- La combinaison de l'intensité de la tendance et de l'indicateur de dynamique réduit le risque de fausse rupture
- Système de gestion des risques, y compris le contrôle des positions et l'arrêt dynamique des pertes
- Convient pour plusieurs périodes de temps ((M5-MN), avec une forte adaptabilité
- Aide aux opérations de couverture, augmentation des scénarios d'application de la stratégie
Risque stratégique
- Les marchés en crise peuvent générer de fréquents faux signaux
- Les moyennes à long terme sont plus rétrogrades et risquent de manquer des opportunités au début de la tendance
- Le filtrage de multiples indicateurs peut entraîner la perte d'une partie du signal valide.
- Les paramètres d'indicateur fixes peuvent ne pas s'adapter à toutes les conditions du marché
- Les coûts de transaction peuvent affecter la rentabilité des transactions à court terme
Orientation de l'optimisation de la stratégie
- Introduction de paramètres d'indicateur d'adaptation qui sont adaptés à la dynamique de la volatilité du marché
- Augmentation des mécanismes d'identification des environnements de marché, avec des paramètres stratégiques différents selon les conditions du marché
- Optimiser le schéma d'arrêt en tenant compte de la position d'arrêt associée au réglage de la résistance au support
- L'ajout d'indicateurs de volume de transactions améliore la fiabilité du signal
- Développer des mécanismes de commutation de marché qui arrêtent automatiquement les transactions dans des conditions de marché inappropriées
Résumer
La stratégie a été conçue en mettant l'accent sur la fiabilité des signaux et la gestion des risques, et elle est très pratique. La mise en œuvre des recommandations d'optimisation de la stratégie est susceptible d'améliorer encore les performances. Il est recommandé de procéder à une vérification complète des retours avant la mise en œuvre sur le terrain et d'optimiser les paramètres en fonction des caractéristiques de chaque type de transaction.
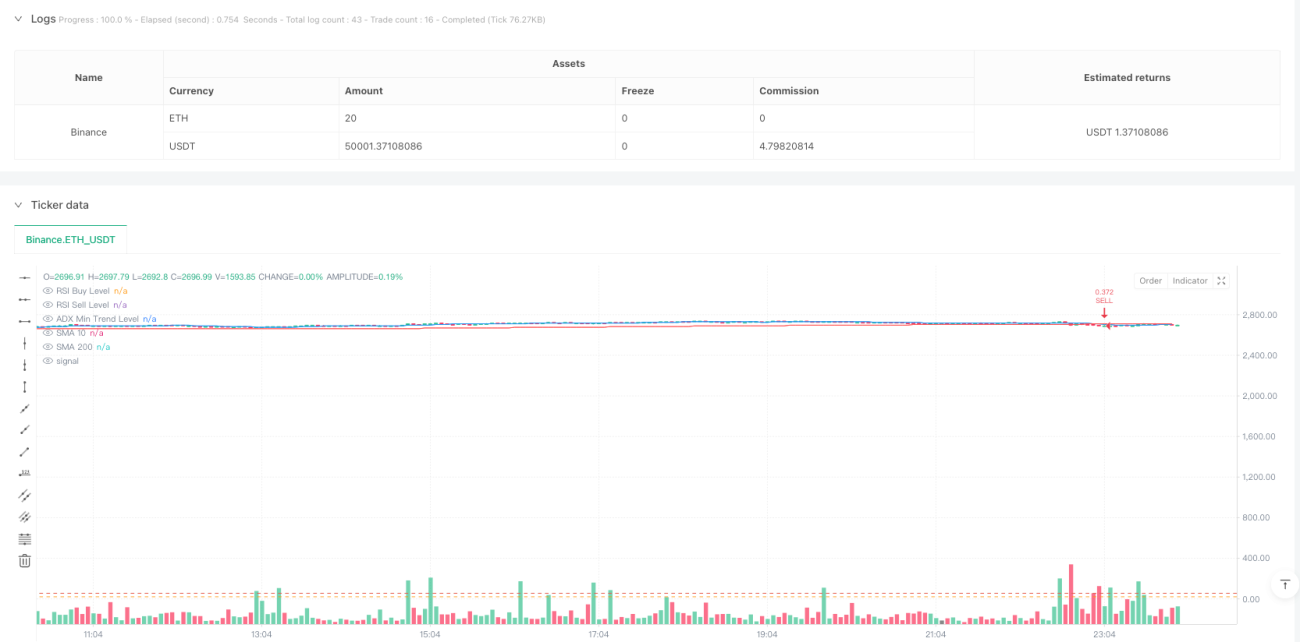
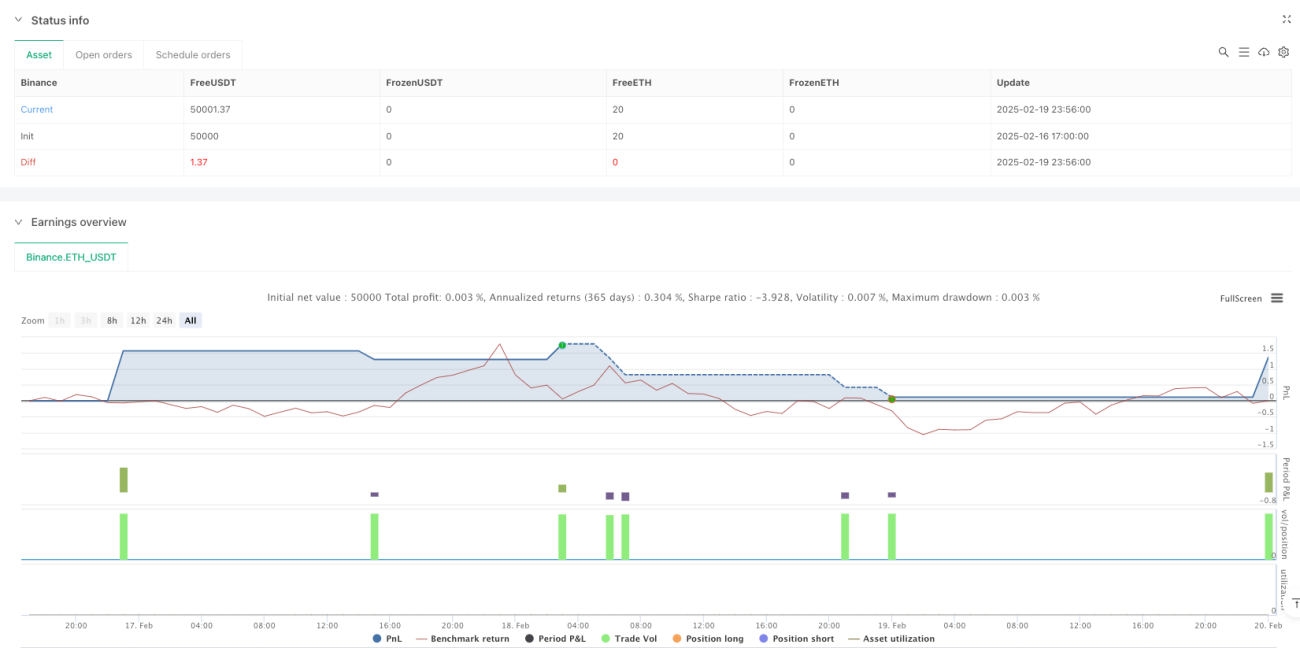
/*backtest
start: 2025-02-16 17:00:00
end: 2025-02-20 00:00:00
period: 4m
basePeriod: 4m
exchanges: [{"eid":"Binance","currency":"ETH_USDT"}]
*/

//@version=6
strategy("SMA + RSI + ADX + ATR Strategy", overlay=true, default_qty_type=strategy.percent_of_equity, default_qty_value=2)

// === Input Parameters ===- 1