
Aperçu
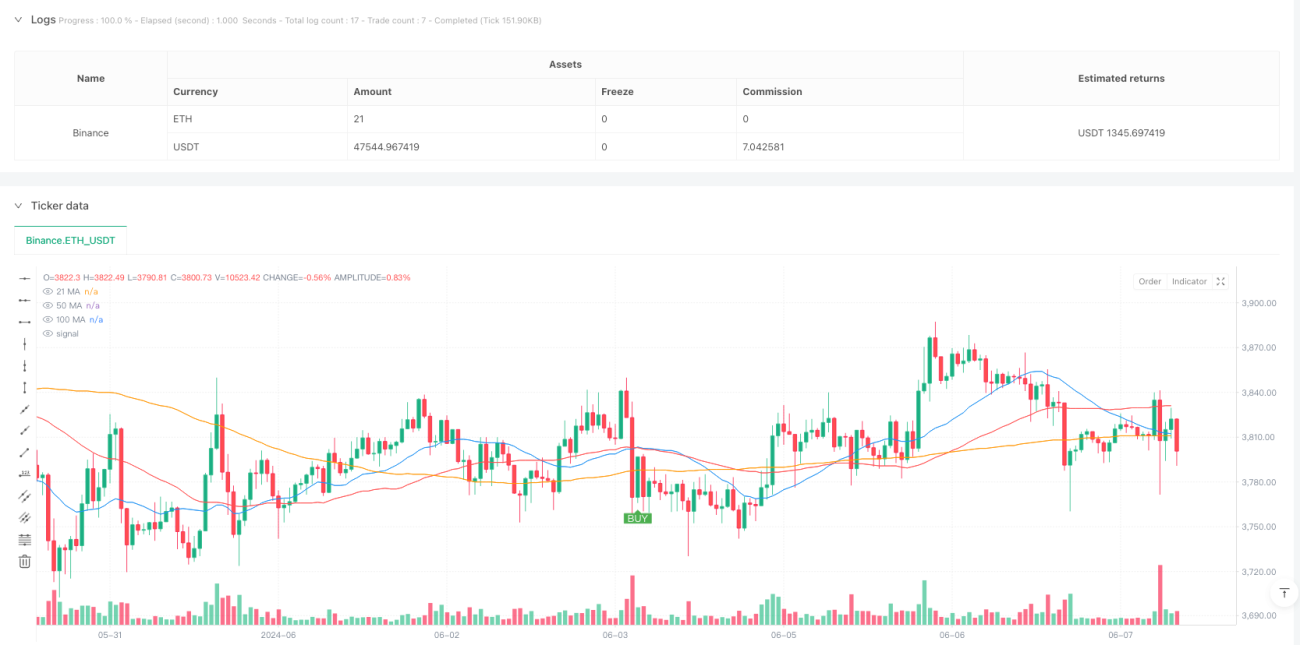
Il s'agit d'une stratégie de suivi de tendance basée sur trois moyennes mobiles simples (SMA). La stratégie utilise les relations de croisement et de position des moyennes mobiles à 21, 50 et 100 cycles pour identifier les tendances du marché et effectuer des transactions au moment opportun. La stratégie fonctionne principalement sur une période de 5 minutes, tout en recommandant de se référer à un graphique de 30 minutes pour la confirmation des tendances.
Principe de stratégie
La stratégie utilise un triple mécanisme de filtrage pour identifier les signaux de transaction:
- Utilisation de la moyenne à 21 cycles comme moyenne rapide pour capturer les variations de prix à court terme
- Utilisation de la moyenne à 50 cycles comme moyenne intermédiaire pour former un signal croisé avec la moyenne rapide
- Utilisation de la moyenne des 100 cycles comme filtre de tendance pour s'assurer que la direction des transactions est conforme à la tendance dominante
Les conditions d'achat doivent être remplies à la fois :
- La moyenne 21 passe à travers la moyenne 50.
- La moyenne 21 et la moyenne 50 sont toutes au-dessus de la moyenne 100.
Les conditions de vente doivent être remplies:
- La moyenne 21 descend à travers la moyenne 50.
- La moyenne 21 et la moyenne 50 sont toutes en dessous de la moyenne 100.
Avantages stratégiques
- Le mécanisme de confirmation multiple réduit les faux signaux
- Le filtrage des tendances améliore le taux de réussite des transactions
- Des règles claires d'entrée et de sortie
- Utilisable sur plusieurs périodes
- Le rapport risque/rendement est fixé à 1:2, ce qui favorise la rentabilité à long terme.
- La logique de la stratégie est simple, facile à comprendre et à exécuter
Risque stratégique
- Les marchés en crise peuvent générer des transactions fréquentes
- Le retard de la moyenne peut entraîner des retards d'entrée et de sortie
- Un revirement rapide de la tendance pourrait entraîner des pertes importantes
- Paramètres à adapter en fonction des conditions du marché
Suggestions de contrôle des risques :
- Le stop loss est placé en dessous du point le plus bas.
- Une tendance à la confirmation associée à une plus grande période de temps
- Évitez de négocier sur des marchés volatiles
- Évaluer et optimiser régulièrement les paramètres de la stratégie
Orientation de l'optimisation de la stratégie
- L'introduction de l'indicateur de volume de transaction confirme la force de la tendance
- Augmentation du mécanisme d'arrêt dynamique
- Ajouter un filtre de force de tendance
- Mécanisme d'adaptation des paramètres d'optimisation
- Confirmation des signaux en combinaison avec d'autres indicateurs techniques
- Augmentation du filtre de volatilité du marché
Résumer
Il s'agit d'une stratégie de suivi de tendance structurée et logiquement claire. Grâce au triple filtrage homogène et au mécanisme de confirmation de tendance, il est possible de réduire efficacement les faux signaux et d'améliorer le taux de réussite des transactions.
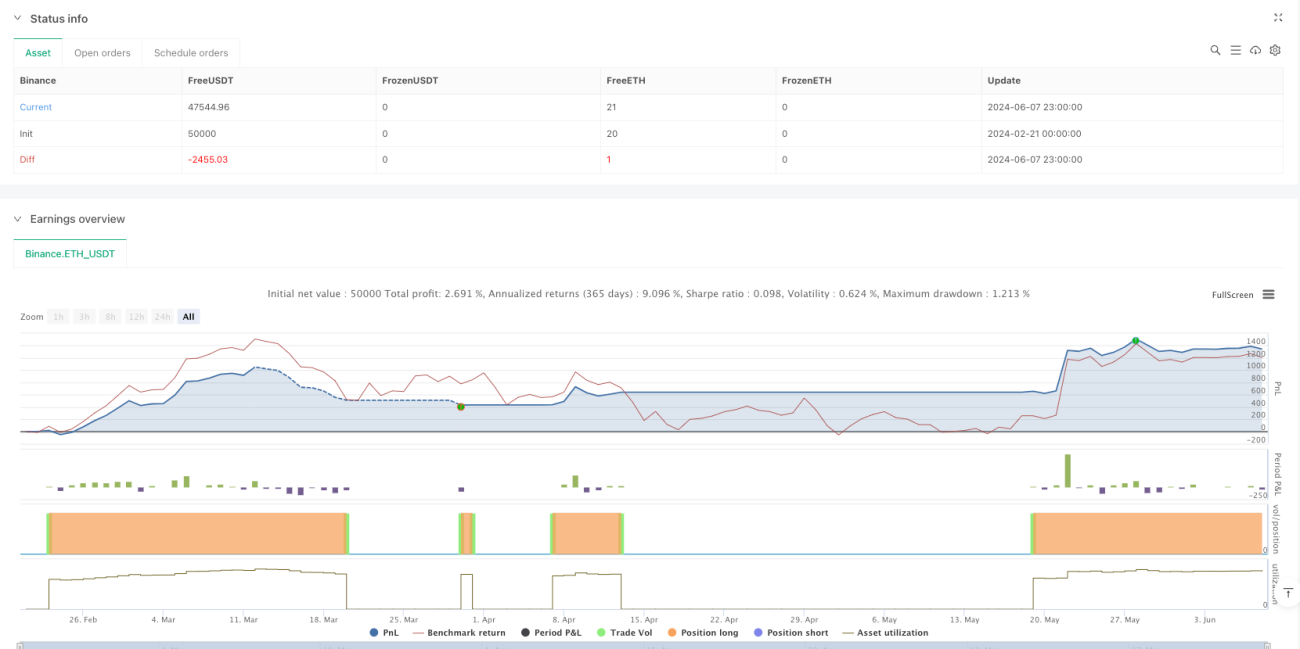
/*backtest
start: 2024-02-21 00:00:00
end: 2024-06-08 00:00:00
period: 1h
basePeriod: 1h
exchanges: [{"eid":"Binance","currency":"ETH_USDT"}]
*/

// This Pine Script™ code is subject to the terms of the Mozilla Public License 2.0 at https://mozilla.org/MPL/2.0/
// © Vezpa
//@version=5
strategy("Vezpa's Gold Strategy", overlay=true)- 1