
Aperçu
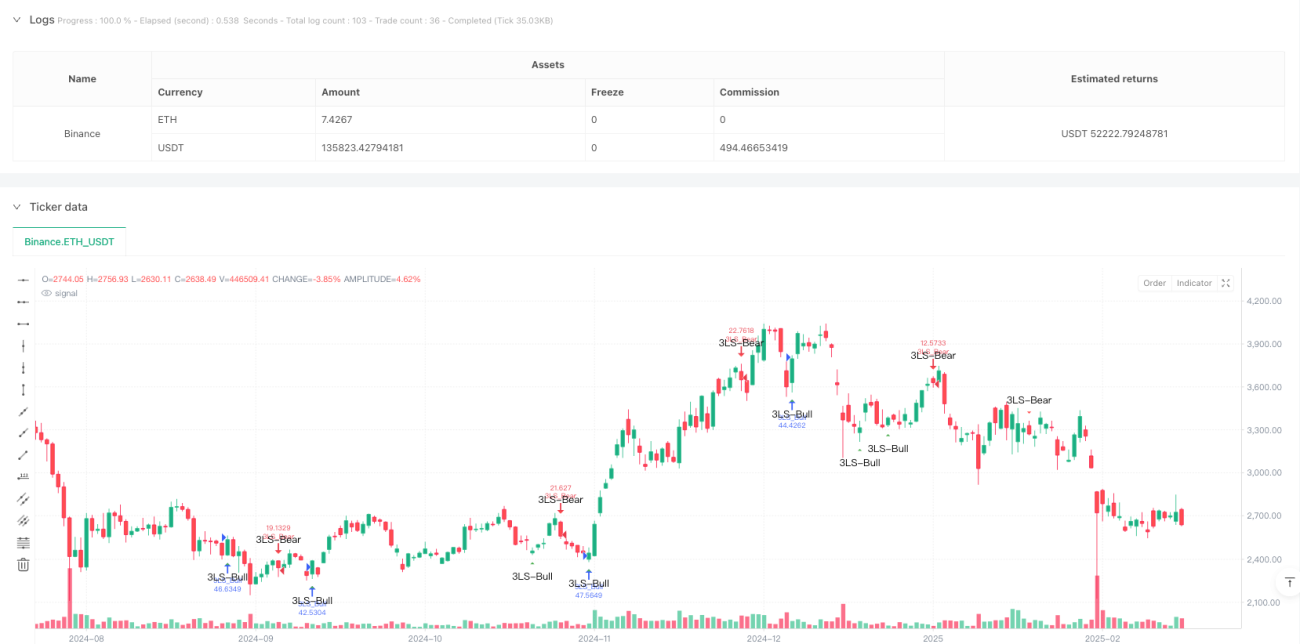
Il s'agit d'une stratégie de négociation quantitative basée sur le Three Line Strike et l'Engulfing Pattern. La stratégie capte les points de retournement de tendance du marché en identifiant les retournements de tendance de la K après trois lignes K consécutives et prend des décisions de négociation en combinant plusieurs indicateurs techniques.
Principe de stratégie
La logique centrale de la stratégie est basée sur deux formes principales de ligne K:
- La forme triple coup: pour juger d'un renversement de tendance, il faut identifier trois lignes K convergentes consécutives. La forme haussière se compose de trois lignes K rouges consécutives à la baisse suivie d'une ligne K verte consécutive à une plus grande absorption.
- La stratégie consiste à comparer la taille de l'entité de la ligne K actuelle à celle de la ligne K précédente pour identifier la forme d'absorption.
Avantages stratégiques
- La détection du signal est précise: la stratégie utilise des calculs mathématiques rigoureux pour juger de la forme de la ligne K, et la qualité du signal est garantie par le filtrage de conditions multiples.
- Contrôle des risques: paramètres de risque tels que le capital initial, le taux de détention et l'interdiction de la réintégration.
- Hauteur personnalisable: offre de nombreux paramètres qui peuvent être optimisés en fonction des différentes caractéristiques du marché et des besoins de la transaction.
- Support visuel: fournit des balises graphiques claires et des astuces pour faciliter l'analyse et la surveillance.
Risque stratégique
- La dépendance aux conditions du marché: il peut y avoir trop de faux signaux dans un marché en crise.
- Effets des points de glissement: les points d'entrée des grands lignes K submergées peuvent être affectés par des points de glissement plus importants.
- Risque de retard: l'identification des formes nécessite de nombreuses lignes K, ce qui peut vous faire manquer le meilleur moment pour entrer.
Orientation de l'optimisation de la stratégie
- Introduction de l'indicateur de trafic: les changements de trafic sont combinés pour filtrer la qualité du signal.
- Optimisation des paramètres de stop loss: réglage dynamique de la position de stop loss en fonction de l'ATR ou de la volatilité.
- Ajout de filtres de tendance: ajout d'un système homogène pour juger de la tendance globale.
- Amélioration du mécanisme de retrait: une conception plus flexible des conditions de retrait.
Résumer
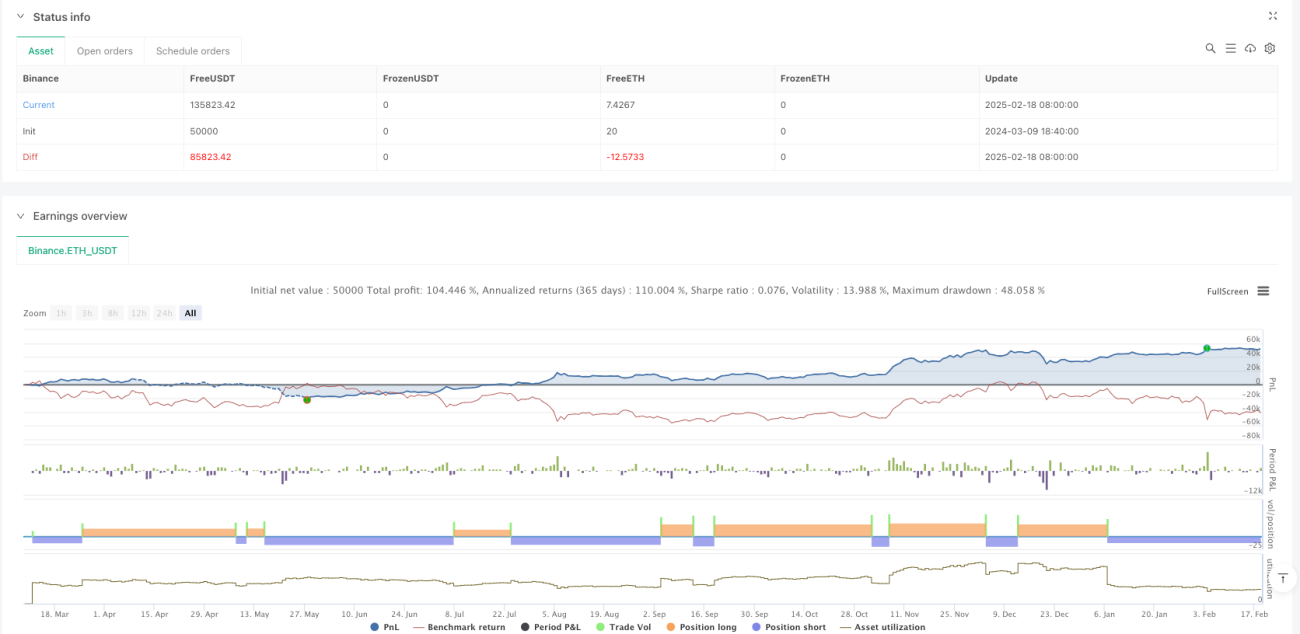
La stratégie capture les points d'inflexion importants du marché grâce à une méthode d'analyse technique systématique, avec une base théorique solide et une valeur pratique. Grâce à l'optimisation des paramètres et à l'amélioration du contrôle des risques, elle peut être utilisée comme une partie importante d'un système de négociation robuste. La conception modulaire de la stratégie fournit également une bonne base pour une optimisation ultérieure.
Overview
This is a quantitative trading strategy based on Three Line Strike and Engulfing patterns. The strategy captures market turning points by identifying breakthrough reversal candlesticks following three consecutive candles, combining multiple technical indicators for trading decisions. It features a complete signal detection system and risk control mechanism, with highly customizable parameter settings.
Strategy Principle
The core logic is based on two main candlestick patterns:
- Three Line Strike Pattern: Identifies trend reversals through three consecutive same-direction candles followed by a reversal candle. Bullish pattern consists of three consecutive red candles followed by a large green engulfing candle; bearish pattern consists of three consecutive green candles followed by a large red engulfing candle.
- Engulfing Pattern: Large single engulfing candles serve as auxiliary signals. The strategy identifies engulfing patterns by comparing the body size of current and previous candles.
Strategy Advantages
- Precise Signal Identification: Uses strict mathematical calculations to judge candlestick patterns, ensuring signal quality through multiple condition filtering.
- Comprehensive Risk Control: Includes risk parameters like initial capital and position sizing, with pyramiding prevention.
- Highly Customizable: Offers rich parameter settings for optimization according to different market characteristics and trading needs.
- Visual Support: Provides clear graphical markers and alert messages for analysis and monitoring.
Strategy Risks
- Market Environment Dependency: May generate excessive false signals in ranging markets.
- Slippage Impact: Entry points for large engulfing candles may be subject to significant slippage.
- Delay Risk: Pattern recognition requires multiple candles, potentially missing optimal entry points.
Optimization Directions
- Incorporate Volume Indicators: Filter signal quality by combining volume changes.
- Optimize Stop Loss Settings: Dynamically adjust stop loss positions based on ATR or volatility.
- Add Trend Filtering: Implement moving average systems to judge overall trend.
- Improve Exit Mechanism: Design more flexible profit-taking conditions.
Summary
The strategy captures important market turning points through systematic technical analysis, with strong theoretical foundation and practical value. Through parameter optimization and risk control refinement, it can serve as an important component of a robust trading system. The modular design also provides a good foundation for further optimization.
- 1