
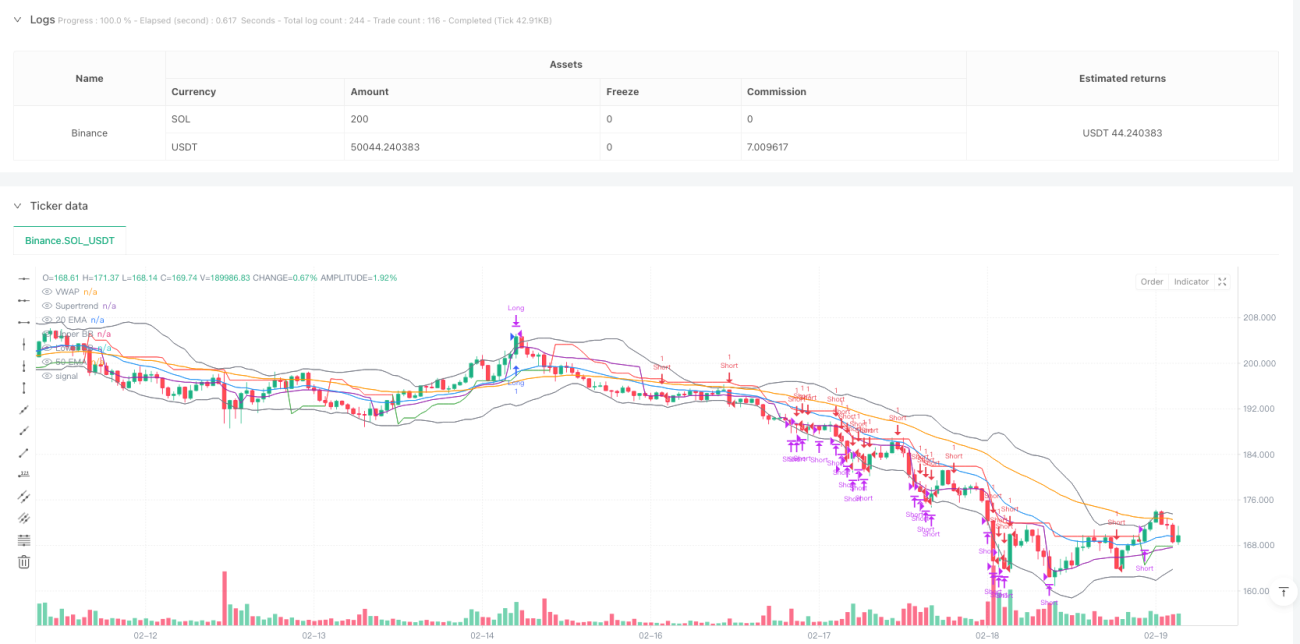
Aperçu
La stratégie est un système de trading auto-adaptatif combinant le suivi des tendances et la négociation des intervalles. Il utilise la synergie de plusieurs indicateurs techniques pour basculer de manière flexible dans différents environnements de marché. La stratégie utilise des indicateurs tels que Supertrend, Moving Average, ADX, RSI et Bollinger Bands pour identifier l'état du marché et déterminer les signaux de négociation, tout en faisant référence aux prix en combinaison avec VWAP et en mettant en place un mécanisme de stop-loss pour contrôler les risques.
Principe de stratégie
La logique centrale de la stratégie est divisée en deux parties: le suivi de la tendance et le trading intermédiaire. Dans les marchés en tendance (déterminés par l'ADX> 25), la stratégie génère des signaux en fonction de la direction de la Supertrend, des croisements EMA et de la position VWAP. Dans les marchés en choc, la stratégie utilise les limites de la ceinture de Brin et le niveau de survente du RSI pour les transactions.
- Mode de suivi des tendances: activé lorsque l'ADX est supérieur à 25, combiné à la relation de position de l'EMA à 20/50 cycles, à la direction de la Supertrend et à la position globale du prix par rapport au VWAP
- Mode de négociation intermédiaire: activé lorsque l'ADX est inférieur à 25 et activé lorsque le prix atteint la limite de la zone de Brin et que le RSI atteint son maximum
- Les conditions de sortie incluent: déclenchement d'un arrêt de perte, renversement de la super tendance ou atteinte du seuil RSI
Avantages stratégiques
- Adaptabilité: la capacité de changer automatiquement de mode de négociation en fonction de l'état du marché
- Vérification multiple: utilisez la vérification croisée de plusieurs indicateurs pour améliorer la fiabilité du signal
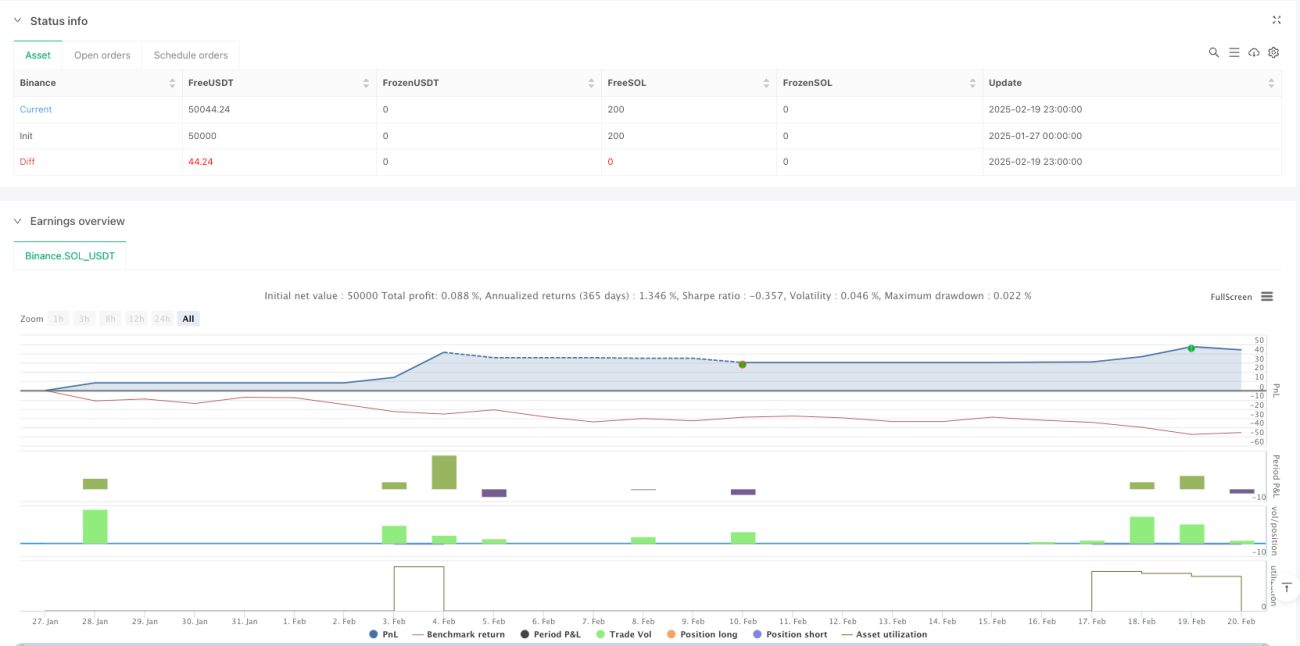
- Contrôle du risque: paramètre un pourcentage fixe de stop loss et utilise les extrêmes du RSI pour un ajustement dynamique
- Une approche globale: maîtriser les tendances tout en profitant de la volatilité des marchés
- Aide visuelle: visualisation des indicateurs importants pour faciliter l'analyse et la prise de décision
Risque stratégique
- Sensitivité des paramètres: les paramètres de plusieurs indicateurs peuvent affecter les performances de la stratégie
- Rarité des signaux: les indicateurs techniques eux-mêmes sont en retard
- Risque de fausse percée: Faux signaux sur le marché horizontal
- Complexité de calcul: le calcul en temps réel de plusieurs indicateurs peut affecter l'efficacité de l'exécution
- Adaptabilité du marché: peut être faible dans certains environnements de marché
Orientation de l'optimisation de la stratégie
- Ajustement des paramètres dynamiques: les paramètres des indicateurs peuvent être ajustés automatiquement en fonction de la volatilité
- Introduction de l'analyse du trafic: ajout d'indicateurs de trafic pour vérifier l'efficacité du signal
- Optimisation du mécanisme de stop-loss: utilisation du stop-loss dynamique ATR peut être envisagée
- Ajout de filtres temporels: ajout d'une fenêtre de temps de transaction pour éviter les périodes d'inefficacité
- Indicateur de l'humeur des marchés: intégrer l'indicateur de l'humeur des marchés pour améliorer la précision des prévisions
Résumer
Il s'agit d'une stratégie intégrée conçue de manière rationnelle et logique. Grâce à la combinaison de plusieurs indicateurs et à la commutation des modes, une certaine adaptabilité peut être maintenue dans différents environnements de marché. Bien qu'il existe des risques potentiels, la stratégie a une bonne valeur d'application pratique grâce à un contrôle raisonnable des risques et à une optimisation continue.
- 1