Système de trading de tendance adaptatif multidimensionnel intelligent

Aperçu
La stratégie est un système de trading intelligent qui combine plusieurs indicateurs techniques pour identifier les opportunités de marché grâce à une analyse intégrée de l'écart de juste valeur (FVG), des signaux de tendance et du comportement des prix. Le système utilise un mécanisme de double stratégie, combinant le suivi des tendances et les caractéristiques de la négociation en bandes, pour optimiser la performance des transactions grâce à la gestion dynamique des positions et à un mécanisme d'exit multidimensionnel. La stratégie accorde une attention particulière à la gestion des risques et améliore la qualité du signal grâce au filtrage de la volatilité et à la confirmation du volume des transactions.
Principe de stratégie
La logique de base de la stratégie repose sur les dimensions suivantes:
- Identification des lacunes FVG - recherche d'opportunités de trading potentielles en calculant la taille des lacunes de saut de prix
- Système de confirmation de tendance - Le système de confirmation de tendance du marché est combiné à la moyenne quotidienne de 200, à l'indicateur SuperTrend et au MACD
- Confirmation de fonds intelligents - utilise le RSI comme condition déclenchante pour les transactions de surachat, de survente et de comportement anormal des prix
- Gestion dynamique des positions - pour ajuster la taille des positions en fonction de la volatilité de l'ATR et assurer la cohérence des emplacements de risque
- Mécanisme de sortie à plusieurs niveaux - Gestion des sorties de transactions en utilisant une combinaison de tracking stop-loss et de stop-goal
Avantages stratégiques
- Adaptabilité - la stratégie peut ajuster automatiquement les paramètres et les positions en fonction des fluctuations du marché
- Contrôle des risques parfait - contrôle des risques grâce à des filtres multiples et une gestion rigoureuse des positions
- Qualité fiable du signal - amélioration de l'exactitude des signaux de transaction par confirmation d'indicateurs multidimensionnels
- Des méthodes de trading flexibles - qui permettent de saisir à la fois les tendances et les occasions de choc
- La science de la gestion des fonds - Utilisez la gestion des risques pour assurer la rationalité de l'utilisation des fonds
Risque stratégique
- Sensitivité des paramètres - la configuration de plusieurs paramètres peut affecter la performance de la stratégie et nécessite une optimisation continue
- Dépendance aux conditions du marché - des faux signaux de rupture peuvent apparaître dans certaines conditions du marché
- Effets de dérapage - un dérapage plus important est possible dans les marchés moins liquides
- Complexité de calcul - le calcul de multiples indicateurs peut entraîner un retard de signal
- Des exigences financières élevées - une stratégie de mise en œuvre complète nécessite un capital initial important
Orientation de l'optimisation de la stratégie
- Optimisation des poids des indicateurs - des méthodes d'apprentissage automatique peuvent être introduites pour ajuster dynamiquement les poids de chaque indicateur
- Amélioration de l'adaptabilité des marchés - un mécanisme d'adaptation qui augmente la volatilité des marchés
- Amélioration du filtrage des signaux - introduction de plus d'indicateurs de la microstructure du marché
- Optimisation des mécanismes d'exécution - augmentation des mécanismes intelligents de segmentation des commandes et réduction des coûts d'impact
- Mise à niveau des contrôles des risques - ajout d'un système de gestion dynamique des budgets de risques
Résumer
Cette stratégie utilise plusieurs indicateurs techniques et techniques de négociation pour construire un système de négociation complet. Son avantage réside dans sa capacité à s'adapter aux changements du marché tout en maintenant un contrôle strict des risques. Bien qu'il existe une certaine marge d'optimisation, dans l'ensemble, c'est une stratégie de négociation quantitative bien conçue.
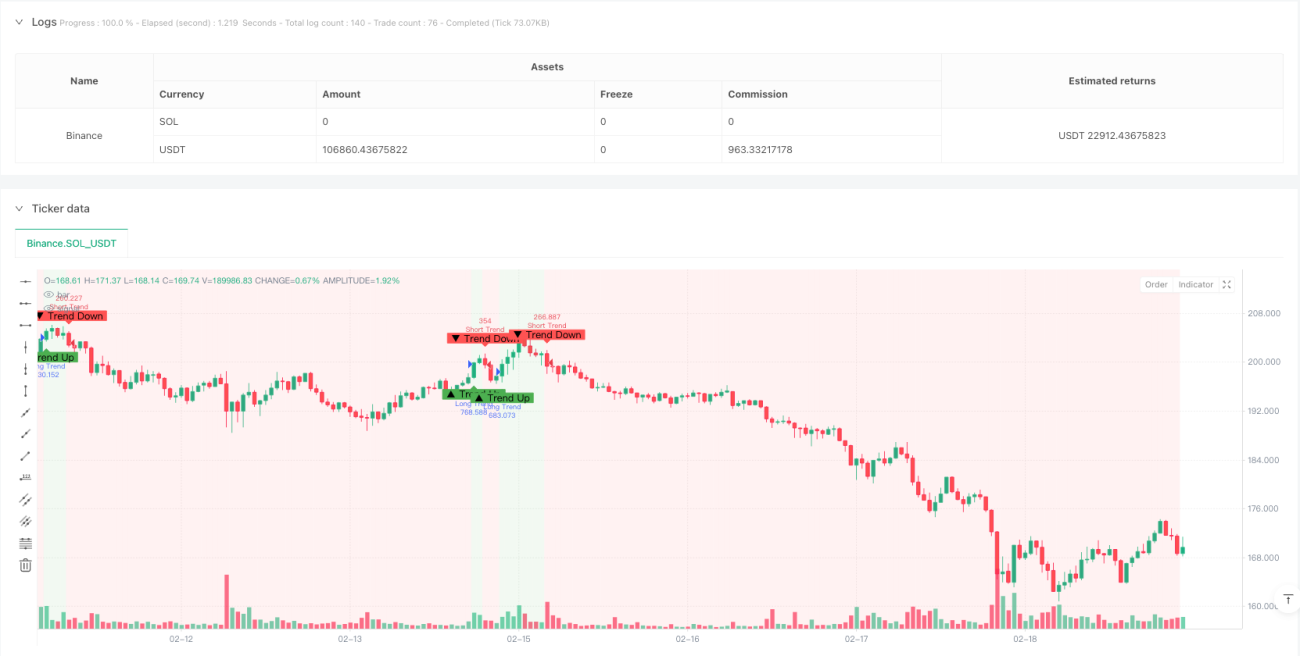
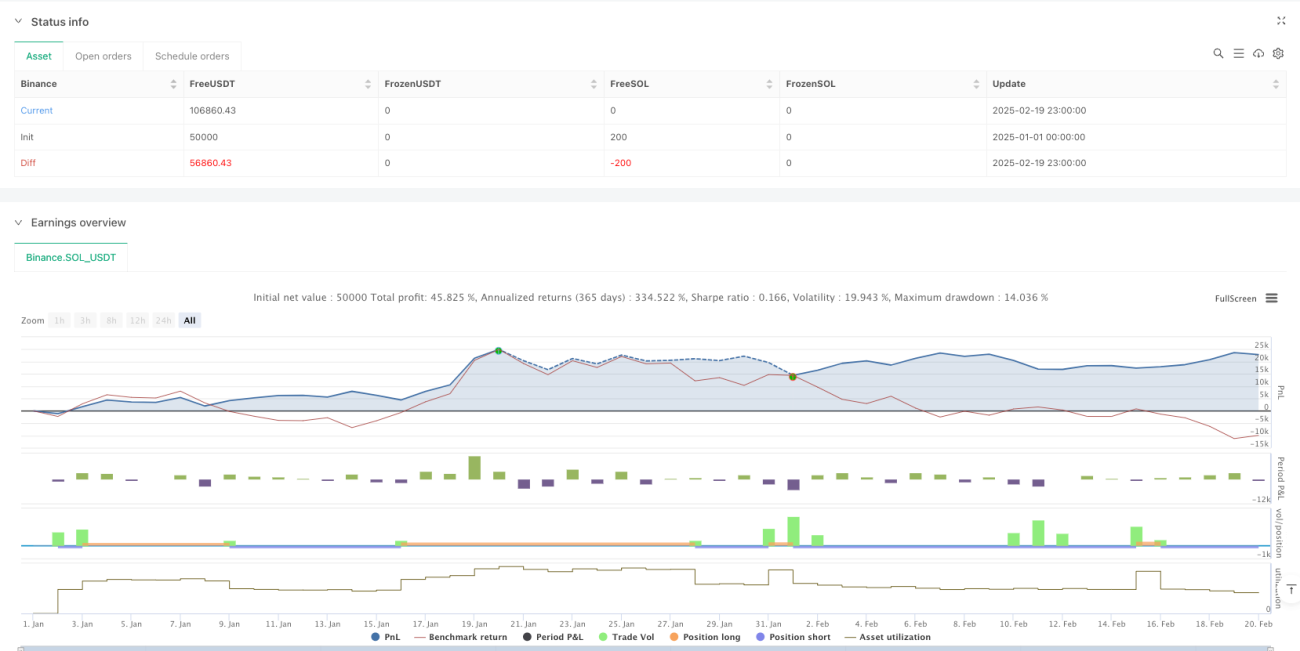
/*backtest
start: 2025-01-01 00:00:00
end: 2025-02-20 00:00:00
period: 1h
basePeriod: 1h
exchanges: [{"eid":"Binance","currency":"SOL_USDT"}]
*/

//@version=6
strategy("Adaptive Trend Signals", overlay=true, margin_long=100, margin_short=100, pyramiding=1, initial_capital=50000, default_qty_type=strategy.percent_of_equity, default_qty_value=100, commission_type=strategy.commission.percent, commission_value=0.075)

// 1. Enhanced Inputs with Debugging Options- 1