
Aperçu
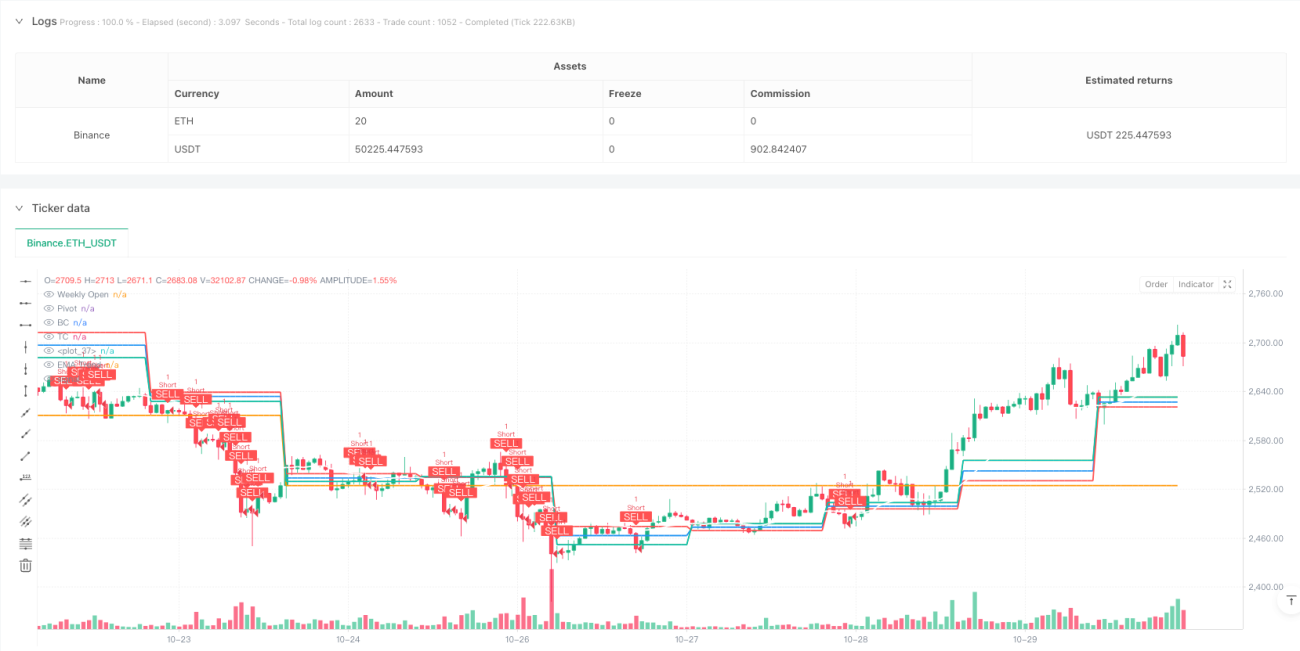
Cette stratégie est un système de négociation basé sur l'analyse de plusieurs périodes de temps, utilisant principalement la fourchette de prix centrale (CPR), l'indice des moyennes mobiles (EMA) et l'indicateur de force relative (RSI). La stratégie identifie les tendances du marché et les points de résistance de soutien clés à travers les niveaux de CPR du jour, le prix d'ouverture hebdomadaire et l'EMA de 20 cycles, et combine la confirmation de la transaction pour effectuer des transactions.
Principe de stratégie
Le cœur de la stratégie est de rechercher des opportunités de trading en analysant la relation entre le prix et le niveau de CPR. La CPR se compose d'un pivot, d'un centre inférieur et d'un centre supérieur. Lorsque le prix franchit TC et que le marché est à plusieurs têtes, le système émet plusieurs signaux; lorsque le prix franchit BC et que le marché est à vide, le système émet un signal vide.
Avantages stratégiques
- Mécanisme de confirmation multiple: une triple confirmation combinant le comportement des prix, la direction des tendances et le volume des transactions, améliore la fiabilité des signaux de négociation
- Gestion dynamique des risques: arrêt dynamique des pertes basé sur la largeur du CPR, adapté aux différentes conditions du marché
- Options de personnalisation flexibles: cycle de CPR, durée des EMA et confirmation de déviation RSI activée/arrêtée
- Asymétrie des gains: un ratio de gains/risques de 1,5:1 améliore la rentabilité à long terme
- Analyse multi-périodes: offre une vue plus complète du marché en intégrant les données de jour et de jour
Risque stratégique
- Risque de fausse rupture: Faux signaux de rupture peuvent survenir dans des marchés en crise, il est recommandé d'utiliser des conditions de filtrage de volume plus strictes
- Risque de renversement de tendance: il peut y avoir des retraits plus importants à des points de renversement de tendance, le risque peut être contrôlé en réduisant la zone de stop loss
- Sensitivité des paramètres: la performance de la stratégie est sensible à des paramètres tels que la longueur de l'EMA et la chute de la quantité de transaction, nécessitant une optimisation périodique
- Dépendance aux conditions du marché: le rapport bénéfice-risque peut être difficile à atteindre dans un environnement à faible volatilité
- Points de glissement d'exécution: les points de glissement peuvent être plus importants dans des conditions rapides, ce qui affecte l'efficacité des transactions réelles.
Orientation de l'optimisation de la stratégie
- Introduction d'un mécanisme d'adaptation à la volatilité: les objectifs de stop-loss et de profit sont ajustés en fonction de la dynamique de la volatilité du marché
- Augmentation de la classification des états du marché: segmentation des tendances et regroupement des marchés, avec différents paramètres de transaction
- Optimiser les filtres de trafic: prendre en compte les variations de trafic par rapport à une simple comparaison de moyenne
- Amélioration du mécanisme de sortie: augmentation des stop-loss mobiles et des gains partiels
- Ajout de filtres temporels: évitez de négocier pendant des périodes spécifiques, telles que les périodes de forte volatilité avant et après l'ouverture et la fermeture du marché
Résumer
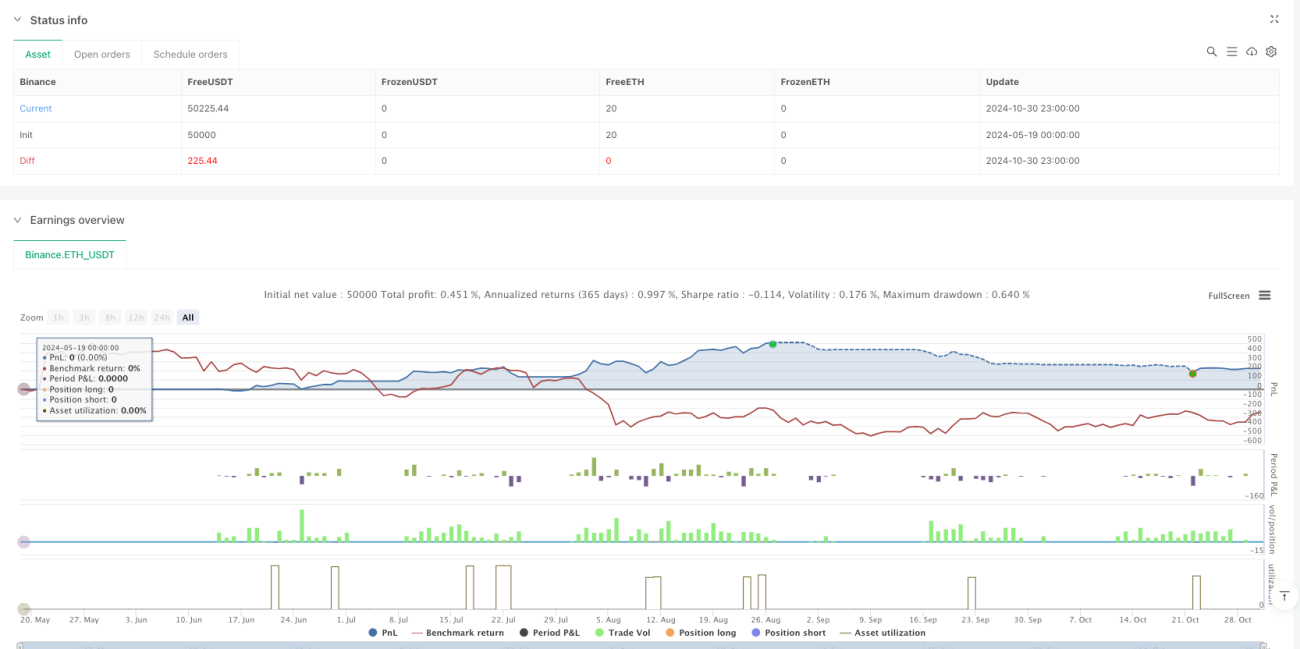
Il s'agit d'une stratégie de suivi de tendance structurée et logiquement claire, qui maîtrise efficacement le risque de négociation grâce à l'utilisation combinée de plusieurs indicateurs techniques. Le principal avantage de la stratégie réside dans sa configuration de paramètres flexibles et son mécanisme de gestion du risque parfait, mais elle nécessite également que les traders suivent les changements de l'environnement du marché et ajustent les paramètres de la stratégie en temps opportun.
//@version=5
strategy("Ahmad Ali Khan CPR Strategy", overlay=true, margin_long=100, margin_short=100)

// ———— Inputs ————
use_daily_cpr = input.bool(true, "Use Daily CPR Levels")
ema_length = input.int(20, "EMA Trend Filter Length")
show_week_open = input.bool(true, "Show Weekly Open Price")
enable_divergence = input.bool(true, "Enable RSI Divergence Check")

// ———— Daily CPR Calculation ————
daily_high = request.security(syminfo.tickerid, "D", high[1], lookahead=barmerge.lookahead_on)
daily_low = request.security(syminfo.tickerid, "D", low[1], lookahead=barmerge.lookahead_on)- 1