
Aperçu
La stratégie est un système de trading de suivi de tendance basé sur la rupture du canal Donchian, combinant l'indicateur SuperTrend et le filtre de volume de transaction pour renforcer la fiabilité du signal de transaction. La stratégie identifie principalement les opportunités de négociation à plusieurs niveaux potentiels en capturant les hauts historiques de rupture des prix, tout en utilisant la confirmation de volume de transaction et les indicateurs de suivi de tendance pour filtrer les faux signaux de rupture.
Principe de stratégie
La logique fondamentale de la stratégie repose sur les éléments clés suivants :
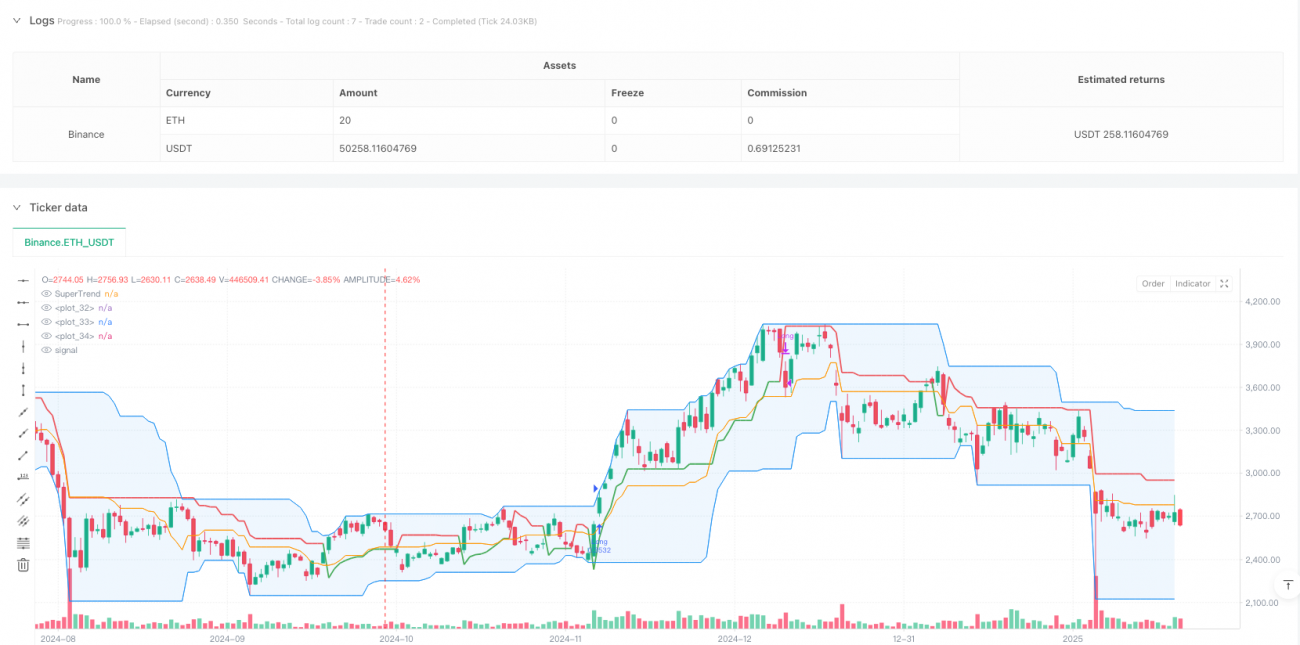
- Le canal de Dongxian: Calcule le prix le plus élevé et le prix le plus bas dans un cycle défini par l'utilisateur, formant un haut, un bas et un milieu. Lorsque le prix franchit le haut, déclenche un signal d'entrée à plusieurs têtes.
- Filtre de transaction: améliore la fiabilité de la rupture en comparant le volume de transaction actuel avec la moyenne mobile à 20 cycles, en veillant à ne participer que lorsque le volume de transaction augmente.
- L'indicateur de super-tendance: comme outil de confirmation de tendance, il affiche le vert pour les tendances à plusieurs têtes et le rouge pour les tendances à tête nue.
- Un mécanisme d'arrêt flexible: quatre options d'arrêt différentes sont proposées, y compris l'arrêt de basse voie, l'arrêt de milieu de voie, l'arrêt de super-tendance et l'arrêt de suivi en pourcentage.
Avantages stratégiques
- Confirmation de signaux multiples: la combinaison de la confirmation de rupture de prix, de la confirmation de volume de transaction et des indicateurs de tendance réduit considérablement le risque de fausse rupture.
- Adaptabilité: Adaptation aux différents environnements de marché et cycles de négociation par ajustement des paramètres.
- Gestion des risques: offre une large gamme d'options de stop-loss, permettant de choisir la méthode de stop-loss la plus appropriée en fonction des caractéristiques du marché
- L'interface stratégique affiche les indicateurs de manière intuitive pour aider les traders à comprendre l'état du marché.
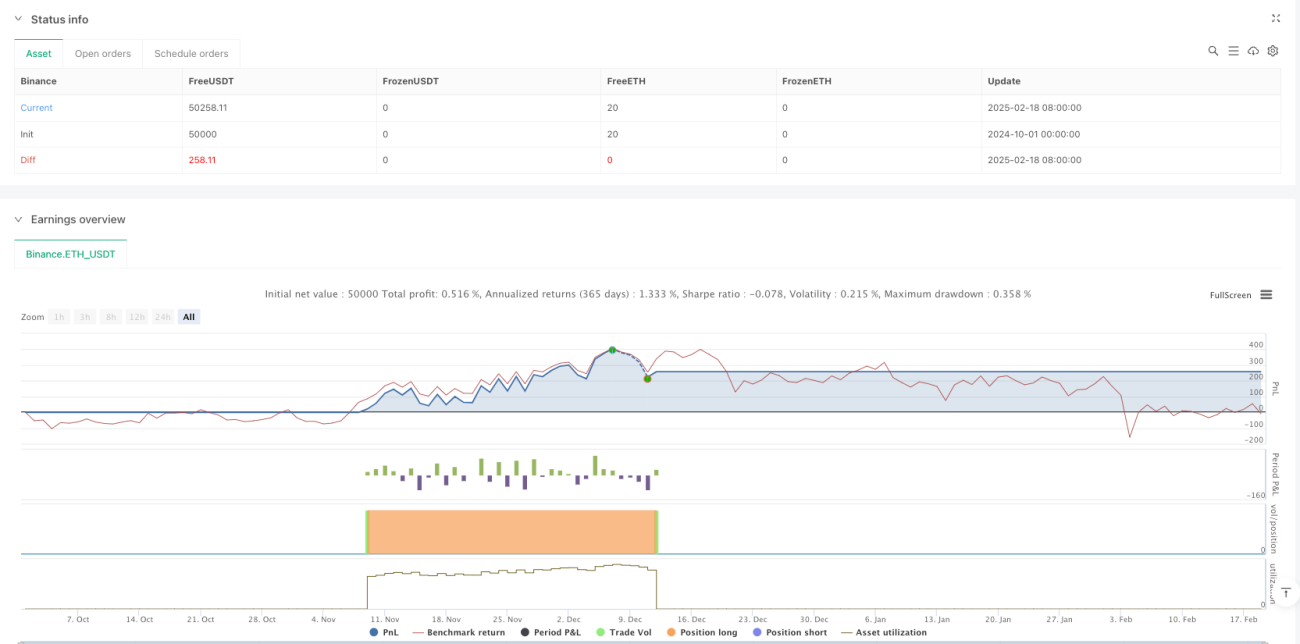
- Flexibilité des retours: permet de personnaliser les intervalles de temps de retours pour faciliter l'optimisation des stratégies.
Risque stratégique
- Risque de choc du marché: des faux signaux de rupture fréquents peuvent être générés dans des zones de choc.
- Risque de glissement: dans les marchés moins liquides, un signal de rupture peut entraîner un écart du prix d'entrée en raison d'un glissement.
- Risque de sur-filtrage: le filtrage du volume de transactions peut vous faire manquer des opportunités de trading efficaces.
- Sensibilité des paramètres : L’effet de la stratégie est sensible aux réglages des paramètres et nécessite une optimisation minutieuse.
Orientation de l'optimisation de la stratégie
- Ajouter un filtre de force de tendance: des indicateurs de force de tendance tels que l'ADX peuvent être ajoutés, ne jouant que lorsque la tendance est forte.
- Optimisation des indices de transaction: il est possible d'envisager d'utiliser des indices de transaction de rupture ou des indices de transaction de rupture plutôt que des moyennes mobiles simples.
- Ajout de filtres temporels: ajout de paramètres de fenêtre de temps de négociation pour éviter les périodes de plus grande volatilité du marché.
- Optimisation des paramètres dynamiques: Ajuste automatiquement les paramètres des cycles de passage et des super-tendances en fonction des fluctuations du marché.
- L'introduction de l'apprentissage automatique: optimiser la sélection des paramètres et le filtrage des signaux à l'aide d'algorithmes d'apprentissage automatique.
Résumer
La stratégie utilise plusieurs indicateurs techniques pour construire un système de suivi de tendance relativement complet. L'avantage de la stratégie réside dans la fiabilité du signal et la flexibilité de la gestion des risques, mais elle nécessite toujours l'optimisation des paramètres par les traders en fonction des caractéristiques spécifiques du marché. Grâce à l'amélioration et à l'optimisation continues, la stratégie est susceptible d'obtenir un effet de négociation stable sur un marché tendance.
- 1