Stratégie de trading adaptative de la grille de Bollinger

Aperçu
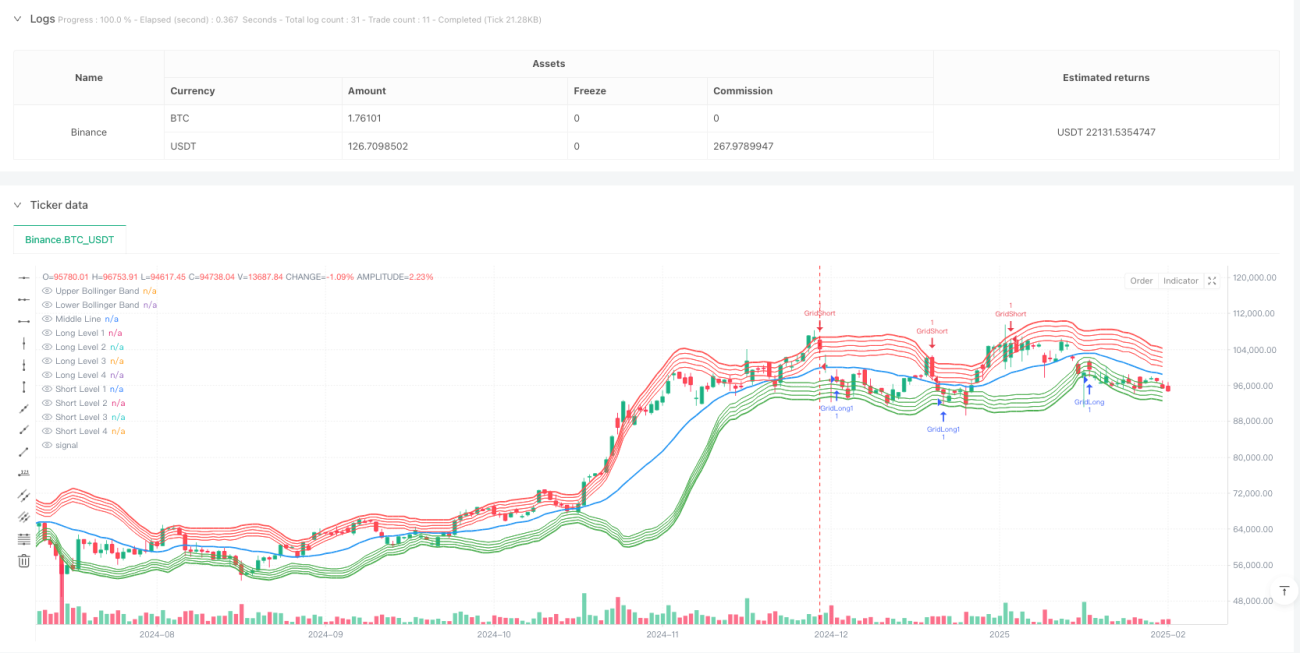
Il s'agit d'une stratégie de négociation de grille avancée basée sur les indicateurs de la ceinture de Brin. La stratégie détermine la position de la grille en fonction de la dynamique des rails supérieurs, inférieurs et intermédiaires de la ceinture de Brin et ajuste automatiquement l'espacement de la grille en fonction de la volatilité du marché. Le système exécute les transactions multi-espaces correspondantes lorsque le prix franchit la ligne de la grille, ce qui permet une négociation de grille entièrement automatisée.
Principe de stratégie
La stratégie utilise une moyenne mobile de 20 cycles comme moyen de la bande de fléchissement, et deux fois l'écart-type comme largeur de bande. Sur la base de la bande de fléchissement, la stratégie a mis en place 4 niveaux de grille avec un espacement de grille de 1% entre les hauts et les bas. Lorsque le prix franchit une ligne de grille vers le haut, le système exécute plusieurs opérations.
Avantages stratégiques
- Adaptation dynamique - la position de la grille se déplace avec les bandes de Brin, permettant aux stratégies de s'adapter à différents environnements de marché
- Risque maîtrisé - Limiter la zone de négociation par la ceinture de Brin pour éviter une position excessive dans des conditions extrêmes
- Automatisation élevée - le système exécute automatiquement les transactions sans intervention humaine
- Le trading bidirectionnel: profiter des hauts et des bas
- Paramètres réglables - l'espacement de la grille et le nombre de niveaux peuvent être ajustés selon les besoins
Risque stratégique
- Risque de marché tendanciel - un retrait plus important est possible dans une tendance unilatérale
- Risques de gestion de fonds - le déclenchement simultané de plusieurs grilles peut entraîner une surtension
- Risque de glissement - une forte volatilité du marché peut entraîner une déviation du prix de transaction par rapport au prix de la grille
- Risques techniques - La bande de Brin pourrait provoquer de faux signaux de détection
Solution:
- Définition de la limite de détention
- Les filtres de tendance sont introduits
- Optimiser le mécanisme d'exécution des commandes
- Ajout d'un filtre pour les signaux de confirmation
Orientation de l'optimisation de la stratégie
- Adaptation de l'espacement de la grille - ajustement dynamique de l'espacement de la grille en fonction du taux d'oscillation
- L'introduction de la relation quantité-prix - le moment d'optimiser l'entrée en bourse en combinant les indicateurs quantitatifs
- Optimiser les mécanismes de prévention des pertes - concevoir des solutions de prévention plus flexibles
- Optimisation de la gestion des fonds - Gestion des positions basée sur le risque
- Synchronisation à cycles multiples - mise en place d'un mécanisme de confirmation de signaux à cycles multiples
Résumer
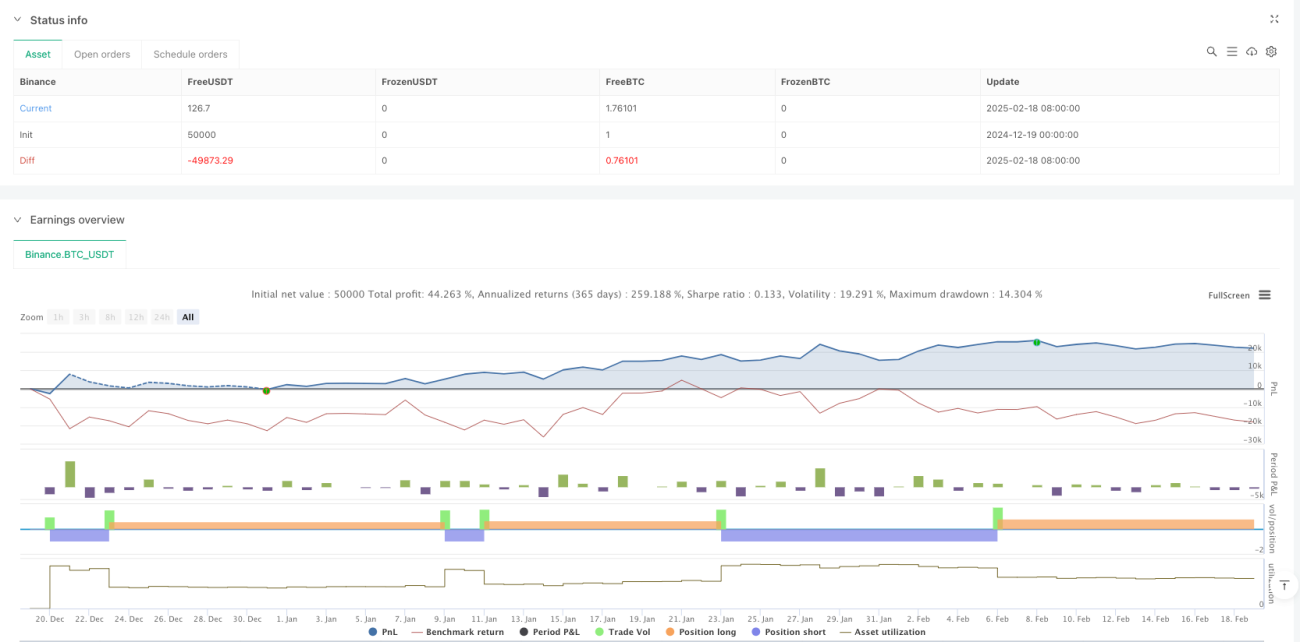
La stratégie a pour avantage central de pouvoir s'adapter à différents environnements de marché tout en contrôlant les risques par des ajustements de paramètres. Bien que certains risques soient inhérents, il est possible de construire un système de trading plus robuste en continuant à optimiser et à améliorer.
- 1