
Aperçu
La stratégie est un système de trading auto-adaptatif combinant un retour en ZigZag et des indicateurs aléatoires. Il identifie les points de retournement critiques en calculant dynamiquement les fluctuations du marché et en combinant des signaux aléatoires de surachat et de survente pour déterminer le moment de la transaction. La stratégie intègre un mécanisme automatique de stop-loss pour gérer efficacement les risques.
Principe de stratégie
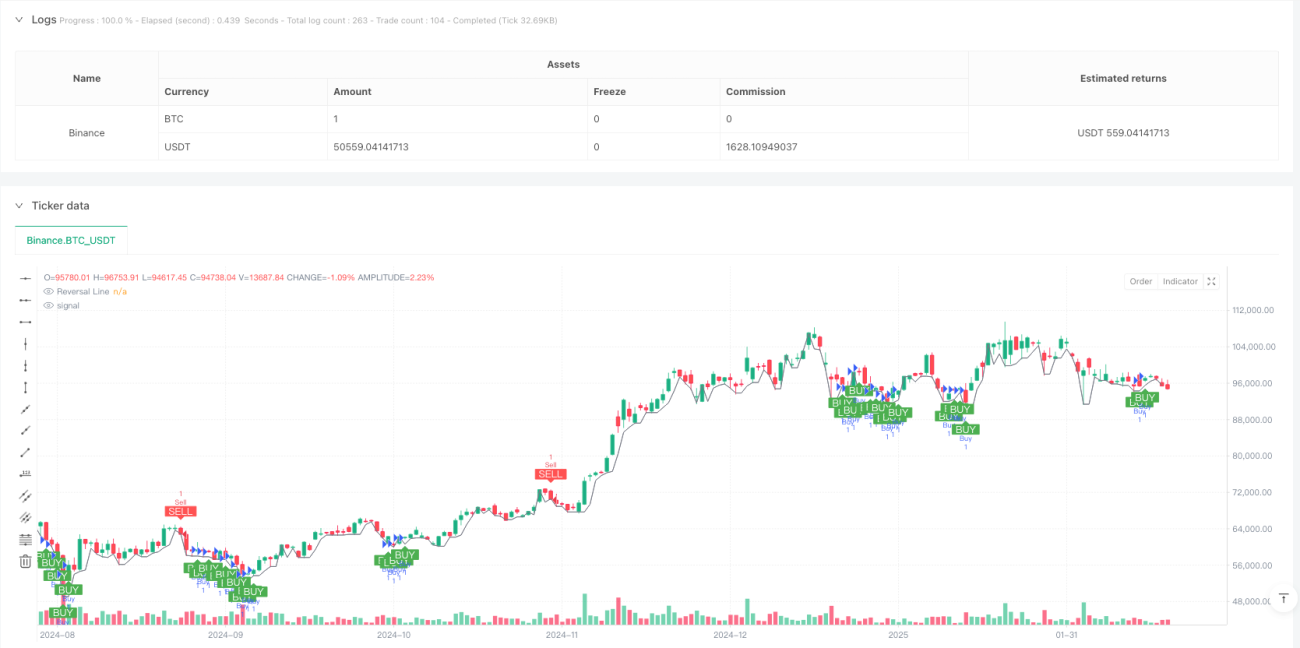
Le cœur de la stratégie est de suivre dynamiquement les tendances du marché via la méthode du pourcentage inverse. Il permet aux utilisateurs de choisir de définir manuellement le pourcentage inverse ou le calcul dynamique de l'ATR sur la base de différentes périodes (de 5 à 250 jours). Un signal de multiplication est généré lorsque le prix franchit la ligne inverse et que la valeur K de l'indicateur aléatoire est inférieure à 30; un signal de pause est généré lorsque le prix franchit la ligne inverse et que la valeur K est supérieure à 70.
Avantages stratégiques
- L'utilisation d'une méthode de calcul inversé qui s'adapte dynamiquement permet une meilleure adaptation aux différentes conditions du marché
- Combiné à un indicateur de tendance inverse et dynamique, il fournit des signaux de trading plus fiables
- Un système de stop-loss intégré pour aider les traders à gérer leurs risques automatiquement
- Les paramètres flexibles permettent aux traders d'optimiser en fonction de leur style de trading personnel
- Des signaux de négociation visualisés pour faciliter l'analyse et la prise de décision
Risque stratégique
- Les faux signaux peuvent être fréquents dans les marchés en crise
- Le choix du cycle ATR influe sur la performance de la stratégie
- Le stop loss fixe peut ne pas être adapté à toutes les conditions du marché
- Indicateur aléatoire qui peut être en retard dans certaines conditions de marché
- Les paramètres doivent être raisonnablement réglés pour éviter les transactions excessives
Orientation de l'optimisation de la stratégie
- Introduction d'analyses multi-temps pour améliorer la fiabilité du signal
- Ajustement dynamique des niveaux de stop loss pour mieux s'adapter aux fluctuations du marché
- Ajout d'un indicateur de volume de transaction comme signal de confirmation
- Développer des paramètres aléatoires qui s'adaptent
- Augmentation de l'intensité de la tendance et réduction des faux signaux par le filtre
Résumer
Il s'agit d'une stratégie de trading moderne combinant les outils classiques de l'analyse technique. Elle offre aux traders un système de trading complet en intégrant le retour ZigZag, les indicateurs aléatoires et la gestion des risques. La stratégie est hautement personnalisable et adaptée aux traders ayant des préférences de risque différentes.
- 1