
Aperçu
La stratégie est un système de trading intelligent basé sur plusieurs indicateurs techniques, combinant les trois principaux indicateurs techniques: les bandes de Bollinger, l'indicateur stochastique et l'amplitude réelle moyenne (ATR), afin d'identifier les opportunités de trading potentielles grâce à une analyse intégrée de la volatilité, de la dynamique et des tendances du marché. La stratégie utilise un paramètre de stop-loss et de profit-targeting dynamique, capable d'ajuster automatiquement les paramètres de trading en fonction des fluctuations du marché.
Principe de stratégie
La logique centrale de la stratégie est basée sur un mécanisme de triple vérification:
- Définition d'une zone de fluctuation des prix à l'aide des bandes de Brin, pour identifier les opportunités de survente lorsque le prix franchit la bande de Brin vers le bas et les opportunités de survente lorsque le prix franchit la bande de Brin vers le haut
- Confirmation de la dynamique par des indicateurs aléatoires dans les zones de survente ((> 80) et de survente ((< 20), la croix des lignes %K et %D comme signal d'entrée
- L'introduction de l'indicateur ATR comme filtre de volatilité pour assurer la négociation avec un soutien suffisant de la volatilité du marché
La génération d'un signal de transaction nécessite que les conditions suivantes soient remplies:
Conditions de l'achat:
- Les cours se sont arrêtés en dessous de la bande de Bryn
- La ligne %K de l'indicateur aléatoire traverse la ligne %D vers le haut dans la zone de survente
- ATR plus élevé que la barre définie, confirmant une volatilité suffisante du marché
Les conditions de vente:
- Les prix se sont arrêtés au-dessus de la ceinture de Brin.
- La ligne %K de l'indicateur aléatoire traverse la ligne %D vers le bas dans la zone de survente
- La valeur ATR est maintenue au-dessus de la marge, confirmant la validité de la transaction
Avantages stratégiques
- La vérification croisée de plusieurs indicateurs techniques améliore considérablement la fiabilité des signaux de transaction
- Définition d'objectifs de stop-loss et de profit dynamiques qui ajustent automatiquement les paramètres de gestion des risques en fonction de la volatilité du marché
- Le mécanisme de filtrage de volatilité évite efficacement les faux signaux pendant les basses fréquences
- Les paramètres de l'indicateur peuvent être ajustés de manière flexible en fonction des différentes conditions du marché, avec une bonne adaptabilité
- La logique de la stratégie est claire, facile à comprendre et à mettre en œuvre, adaptée aux traders de tous niveaux
Risque stratégique
- Des points de glissement peuvent survenir lors de fortes fluctuations du marché et affecter le prix d'exécution réel.
- L'utilisation de multiples indicateurs peut entraîner un retard de signal et une perte du meilleur moment d'entrée.
- L'optimisation excessive des paramètres peut entraîner une suradaptation, affectant la performance de la stratégie dans le disque réel.
- Les signaux de fausse couche peuvent apparaître à des points de basculement de la tendance et nécessitent la collaboration d'autres outils d'analyse
- Les coûts de transaction et les commissions peuvent affecter la performance globale de la stratégie
Orientation de l'optimisation de la stratégie
- Introduction de filtres de tendance, tels que le système de croisement des moyennes mobiles, pour renforcer la confirmation de tendance
- Optimiser le mécanisme d'ajustement dynamique des valeurs ATR pour les adapter mieux aux différentes conditions du marché
- Augmentation de la vérification des indicateurs de transaction et de la fiabilité des signaux de négociation
- Optimisation des paramètres d'adaptation et ajustement automatique des paramètres de l'indicateur en fonction des conditions du marché
- Ajout d'un filtre temporel pour éviter de négocier pendant les heures d'ouverture et de clôture les plus volatiles du marché
Résumer
La stratégie utilise la combinaison des bandes de Brin, des indicateurs aléatoires et des ATR pour construire un système de trading complet. L'avantage de la stratégie réside dans la vérification croisée de plusieurs indicateurs et la gestion dynamique des risques, mais il faut également prêter attention à l'optimisation des paramètres et à l'adaptation à l'environnement du marché.
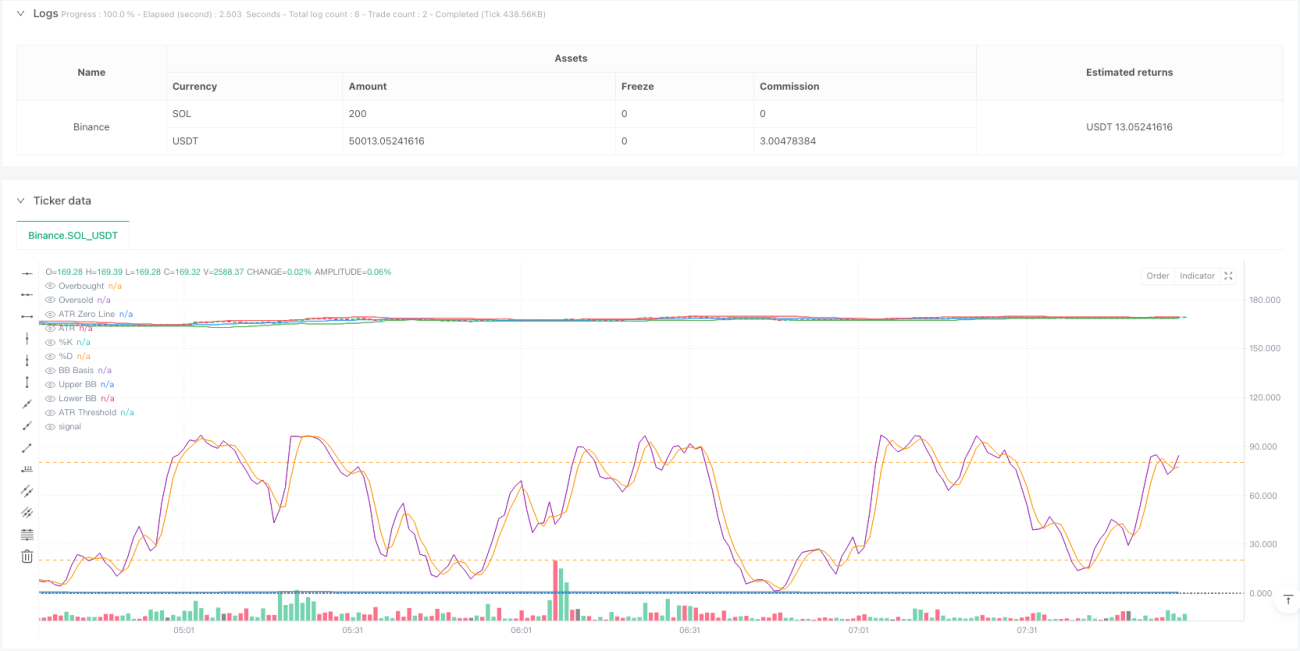
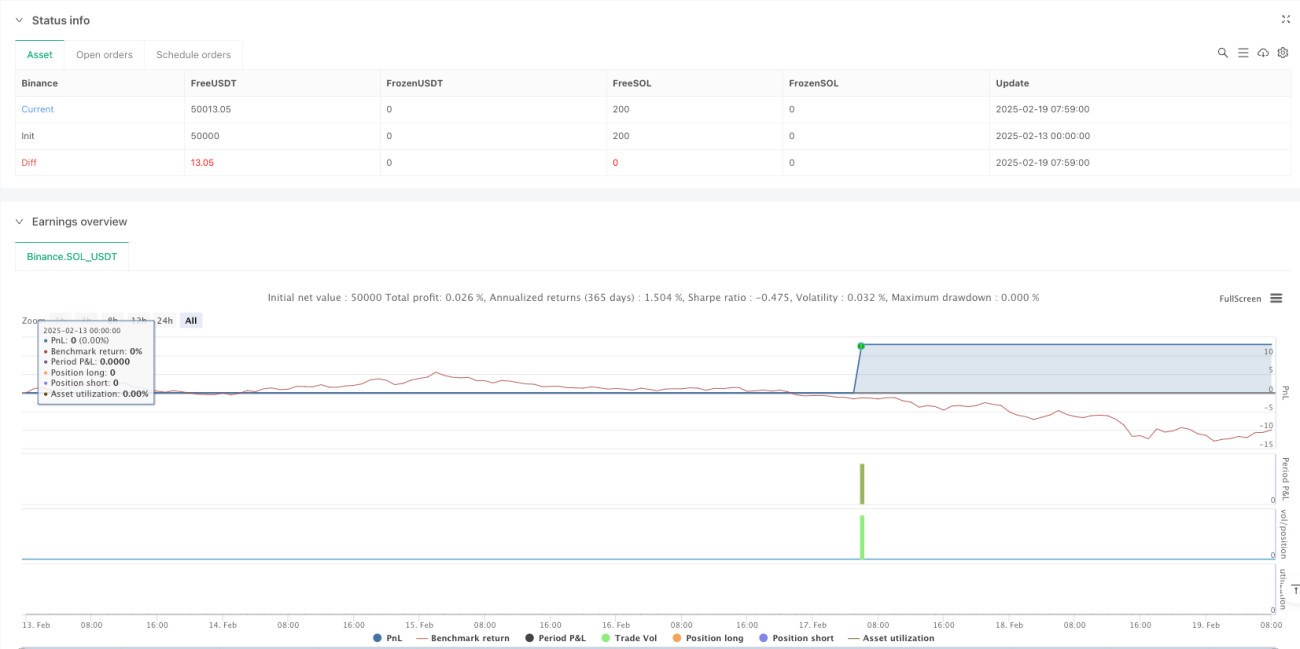
/*backtest
start: 2025-02-13 00:00:00
end: 2025-02-19 08:00:00
period: 1m
basePeriod: 1m
exchanges: [{"eid":"Binance","currency":"SOL_USDT"}]
*/

//@version=5
strategy("Bollinger Bands + Stochastic Oscillator + ATR Strategy", overlay=true, default_qty_type=strategy.percent_of_equity, default_qty_value=10)

// Bollinger Bands Parameters- 1